


Stock Market Negative Divergence Carrying a Dangerous Message?
Stock-Markets / Stock Markets 2011 Jun 20, 2011 - 09:18 AM GMTBy: Marty_Chenard

 Last week we discussed how the Leadership stocks were in retreat. That was a good discussion why the market couldn't hold up since the beginning of June, but today's message is about a longer term Negative Divergence that is potentially very dangerous.
Many investors and technicians are familiar with positive or negative divergences that come from various technical indicators. The problem they have is, that they don't always kick in because the indicator is measuring stock or index movements and it is like trying to take a picture of yourself.
However, there are some kinds of divergences that are very reliable because they tell a story about some very fundamental market changes that are going on.
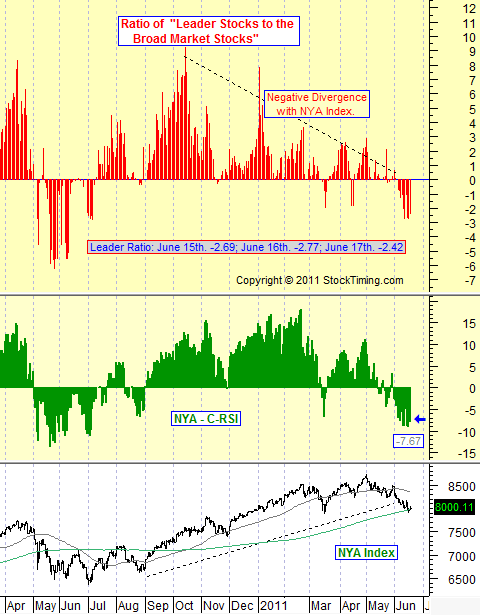
We will share one of these this morning in the form of a 15 month chart that shows the actual data plotted. This data is from nightly computer runs measuring the increasing or decreasing number of Leadership Stocks relative to the Broad Market. (FYI ... By definition, Leadership stocks are just that ... stocks that "lead the stock market higher or lower", depending on their trend.)
For today, let's forget the short term trend and instead, focus on what has happened since September 2010.
For one thing, the current rally sprang forward last September when Leadership stocks had its second burst of rising in numbers ... numbers that were growing faster and stronger than the broad market.
So, let's look at the LONG term picture and how a very dangerous Negative Divergence has now developed.
Take a look at today's chart below. Specifically, look at the black dotted lines we drew on the Leadership Stocks, and the same dotted line we drew on the NYA Index (New York Stock Exchange Index).
What do you see?
Notice how the "trend of the Leadership stocks has gone from a high positive to a negative reading". At the same time, the NYA Index has gone from a low level to a peak level that was above 8500.
This means, that as the stock market has been going up, the Leadership stocks that were pulling the market up have been disappearing. This particular Negative Divergence is potentially very dangerous because there are fewer and fewer Leadership stocks to hold the market up as time goes on.
Due to its extreme importance, this chart is updated and posted every morning on our paid subscribers site. When a negative divergence comes from this data, its is worth paying attention to.
* Feel free to share this page with others by using the "Send this Page to a Friend" link below.
By Marty Chenard
http://www.stocktiming.com/
Please Note: We do not issue Buy or Sell timing recommendations on these Free daily update pages . I hope you understand, that in fairness, our Buy/Sell recommendations and advanced market Models are only available to our paid subscribers on a password required basis. Membership information
Marty Chenard is the Author and Teacher of two Seminar Courses on "Advanced Technical Analysis Investing", Mr. Chenard has been investing for over 30 years. In 2001 when the NASDAQ dropped 24.5%, his personal investment performance for the year was a gain of 57.428%. He is an Advanced Stock Market Technical Analyst that has developed his own proprietary analytical tools. As a result, he was out of the market two weeks before the 1987 Crash in the most recent Bear Market he faxed his Members in March 2000 telling them all to SELL. He is an advanced technical analyst and not an investment advisor, nor a securities broker.
Marty Chenard Archive |
© 2005-2022 http://www.MarketOracle.co.uk - The Market Oracle is a FREE Daily Financial Markets Analysis & Forecasting online publication.