Playing Cat and Mouse with Global Oil
Commodities / Crude Oil Jun 25, 2011 - 03:52 PM GMTBy: Frank_Holmes
 Oil markets took another dose of global geopolitics this week when the International Energy Agency (IEA) unexpectedly announced that it would be releasing 60 million barrels of oil from strategic petroleum reserves (SPR) around the globe. Thursday’s surprise announcement gave oil prices a 4.5 percent hair cut and oil prices closed Friday at $91.25, down 20 percent from their April 29 peak.
The IEA, a Paris-based agency comprised of developed countries around the world, said the release would take place in increments of 2 million barrels per day over 30 days beginning July 1, and is intended to make up for lost crude oil production due to the Libya crisis. The IEA estimates that the fall of Ghaddafi’s regime and civil strife that’s followed has cost global crude supplies 123 million barrels of oil.
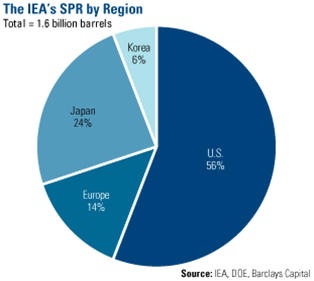
Sixty-million barrels of oil is a large number but represents only a small amount of the 1.6 billion barrels worth of reserves held in SPRs around the globe that are for “emergency use only,” according to Barclays. The U.S. holds a little more than half of these reserves (56 percent) while Japan (24 percent), Europe (14 percent) and Korea (6 percent) hold the rest.

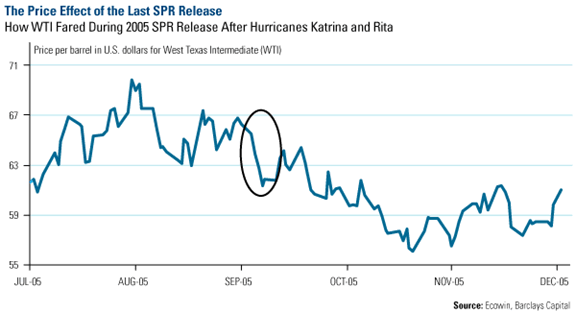
While the short-term effect of the SPR release manifested quickly, it’s difficult to gauge where the market goes from here. For starters, emergency SPR releases are rare and have only been initiated twice in history (Iraq’s invasion of Kuwait in 1990 and following Hurricanes Katrina & Rita in 2005). Then, the releases covered for a little less than 7 percent of global demand, according to Barclays. The current program would only cover a little greater than 2 percent of global oil demand.
This chart from Barclays shows the immediate downward effect the release has on West Texas Intermediate (WTI) prices, but prices returned to pre-Katrina levels relatively quickly.

It should also be noted that the U.S. only sold about half of its first lot and didn’t even offer a second amount of its reserves during the Katrina SPR release, according to J.P. Morgan.
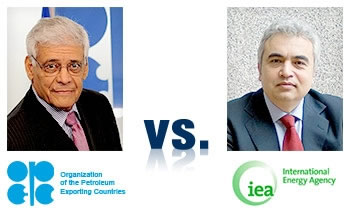
 One cannot ignore the politics in play. Prior to OPEC’s June 8 meeting earlier this month, the IEA called for an OPEC production increase and tipped their hand that they were prepared to tap the SPR. The IEA said “we are prepared to consider using all tools that are at the disposal of IEA member countries,” as reported by Barclays. When the highly contentious OPEC meeting broke without an increase, the IEA was all but forced to act on its threat.
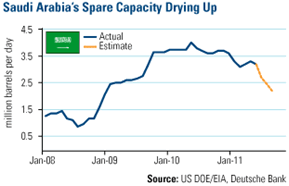
Essentially, the IEA is trying to buy time for Saudi Arabia to increase its production. Saudi oil production has increased in June and that’s expected to continue in July. Despite the increase, Saudi production remains below peak 2008 levels despite global demand reaching new highs.
As long-term investors, we’re less concerned with the game of “cat and mouse” the IEA, OPEC and global politicians are playing with short-term supply and we’re focused on the positive long-term structural supply/demand dynamics. BCA Research forecasts that “further downside is limited” and says that “one-time stock release should have little impact on cyclical or medium-term horizons, as the flow demand for oil from emerging countries keeps steadily growing year after year.”
Barclays argues that the IEA decision to implement the SPR “sends the wrong signal” to the market and will likely result in lower Saudi oil production over the long term, perhaps even by the end of 2011. “The use of SPR, particularly when Saudi Arabia has restated its commitment to supply customers with the crude they need, send the incorrect signal,” says Barclays.
This is partly due to the fact that Saudi oil production doesn’t have much room to grow before it is maxed out. You can see from the chart that Saudi Arabia’s spare capacity is down roughly 25 percent from its peak around this time last year. Forcing additional Saudi production to market means this spare capacity could dry up even further.
 Deutsche Bank (DB) says medium-term supply/demand fundamentals signal relatively tight markets going forward, which could easily return prices to $100 per barrel or higher. In fact, DB thinks the temporary drop in oil prices could relieve pressure on emerging market governments to reduce or eliminate fuel subsidies. Eventually, the IEA and consumers around will have to “surrender” to higher oil prices, says DB.
“The ultimate effect of the IEA’s decision may not just be a few months delay in market tightening, it could exacerbate that tightness, given the need for the SPR to be refilled at some stage,” says Barclays.
Broadly speaking, energy stocks were down 1 percent this week but the long-term appeal remains attractive. BCA cautions to not view the announcement as a reason to sell the S&P energy sector, but as a catalyst to remain bullish, especially given current “attractive” valuations.
We think one of the best opportunities in the market is in the oil services sector and we’ve adjusted our Global Resources Fund (PSPFX) portfolio accordingly. We see sustained higher energy prices as the catalyst for producers and the large, integrated oil companies to spend large amounts of capital on additional rigs, facilities and infrastructure.
One way to measure demand for new equipment is to look at the backlog of orders at construction & engineering firms. BCA said in a May 31 report that “backlog growth is still accelerating…while global leading economic indicators have declined and warn of a global soft patch.” As of the beginning of June, the project backlog for C&E companies was up over 20 percent from the year before—the highest rate since late 2007.
Additionally, this group has strong earnings growth potential because they haven’t yet seen their margins expand to match energy’s current price levels. BCA says “this group is likely to demonstrate significant earnings outperformance, especially as margins in the broad corporate sector begin to narrow.” In addition, higher commodity prices will encourage additional production and give these companies pricing power.
BCA has looked back at the previous 30 years of performance for oil service stocks during rising, falling and flat markets. They found that the S&P Energy Equipment & Services Index handily outperformed the S&P 500 Index during market moves upward. Performance dipped significantly when the credit crisis hit but returned when the market started to rise again.
Although we expect volatility to continue, we believe that an active hurricane season, strong seasonal demand or an additional uprising in the Middle East region all have the ability to further constrain supply and keep prices at historically elevated levels. That doesn’t even include some of the reasons we’ve outlined for you in the past—Read: Three Reasons to Believe in $100 Oil.
This and the factors laid out by BCA make a strong investment case for the oil services group.
Many people are also concerned with the recent performance of gold mining equities. I addressed these concerns in last week’s alert and the positive feedback this week from our highly-engaged readers has been fantastic. In case you missed my special message last week (I know we’re right in the middle of summer vacation season), here is a link—Read: Will Gold Equity Investors Strike Gold?
Director of Research John Derrick contributed to this commentary.
Want to receive commentary from Frank and analysis from the rest of the U.S. Global Investors team delivered to your inbox every Friday? Sign up to receive our weekly Investor Alert at www.usfunds.com.
For more updates on global investing from Frank and the rest of the U.S. Global Investors team, follow us on Twitter at www.twitter.com/USFunds or like us on Facebook at www.facebook.com/USFunds. You can also watch exclusive videos on what our research overseas has turned up on our YouTube channel at www.youtube.com/USFunds.
Please consider carefully the fund's investment objectives, risks, charges and expenses. For this and other important information, obtain a fund prospectus by visiting www.usfunds.com or by calling 1-800-US-FUNDS (1-800-873-8637). Read it carefully before investing. Distributed by U.S. Global Brokerage, Inc.
Standard deviation is a measure of the dispersion of a set of data from its mean. The more spread apart the data, the higher the deviation. Standard deviation is also known as historical volatility. All opinions expressed and data provided are subject to change without notice. Some of these opinions may not be appropriate to every investor. The S&P 500 Stock Index is a widely recognized capitalization-weighted index of 500 common stock prices in U.S. companies. The NYSE Arca Gold BUGS (Basket of Unhedged Gold Stocks) Index (HUI) is a modified equal dollar weighted index of companies involved in gold mining. The HUI Index was designed to provide significant exposure to near term movements in gold prices by including companies that do not hedge their gold production beyond 1.5 years. The MSCI Emerging Markets Index is a free float-adjusted market capitalization index that is designed to measure equity market performance in the global emerging markets. The U.S. Trade Weighted Dollar Index provides a general indication of the international value of the U.S. dollar.
Frank Holmes Archive |
© 2005-2022 http://www.MarketOracle.co.uk - The Market Oracle is a FREE Daily Financial Markets Analysis & Forecasting online publication.


