


Stock Market New Uptrend ... Higher Highs Ahead
Stock-Markets / Stock Markets 2011 Jul 02, 2011 - 02:27 PM GMTBy: Tony_Caldaro

 An eventful week as the US market had its biggest upsurge since early July 2010. Economic reports ended the week with a positive bias too: positives outpacing negatives 9 to 6. On the negative side: the monetary base, WLEI, construction spending, consumer sentiment, and consumer confidence all declined.
The weekly jobless claims ticked higher too. On the positive side: excess reserves, PCE prices, Case-Shiller, pending home sales, the Chicago PMI, ISM manufacturing, and auto sales all moved higher. Personal income/spending remained positive. The equity markets gained every day of the week as the SPX/DOW surged 5.50%, and the NDX/NAZ was +6.35%. Asian markets gained 1.6%, Europe rallied 5.2%, the Commodity equity group was +3.8%, and the DJ World index rose 5.1%. Next week will be highlighted by friday’s Payroll report, ISM services and Factory orders.
LONG TERM: bull market
The bull market resumed this week after a multi-week 8.2% correction. Our primary count remained in place, despite several medium term alternative counts gaining in probability as the correction unfolded. We have been counting this bull market as a five Primary wave Cycle wave one, coming off the Supercycle low of March 2009 at SPX 667. The first two Primary waves completed in April 2010 at SPX 1220 and July 2010 at SPX 1011 respectively. The current Primary wave three began at that time. Since Primary wave I divided into five Major waves, (as noted in black on the chart below), we expected Primary wave III to do the same.
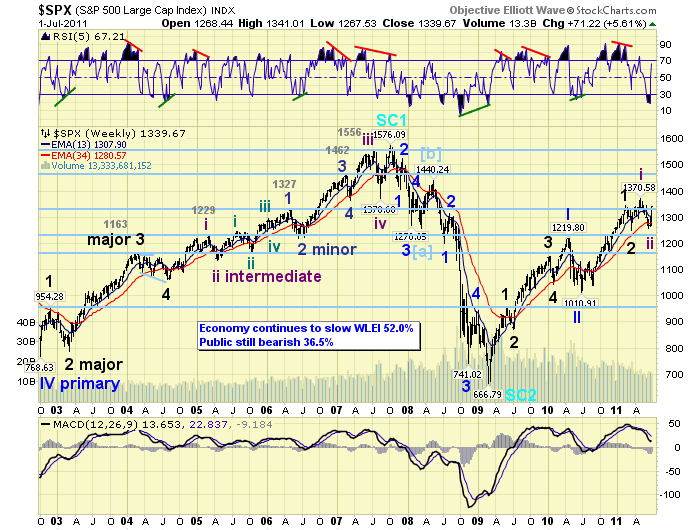
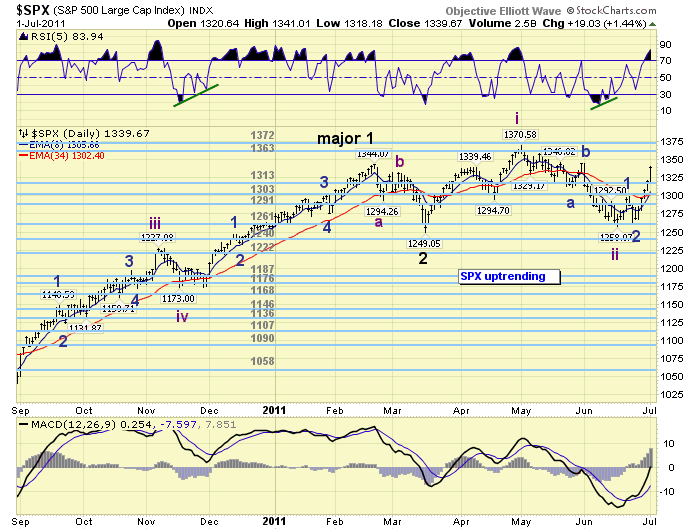
The first uptrend from the SPX 1011 Primary II low topped in February at SPX 1344. We labeled that Major wave 1. The correction to SPX 1249 in March we labeled Major wave 2. Major wave 3 should have started at that low. The following uptrend (Mar-May) and downtrend (May-June) was a bit tricky, in that the Techs (NDX/NAZ) completely retraced the entire uptrend, and the Industrials (SPX/DOW) did not. As a result we now have two slightly different counts between these two sectors. This is not unusual. Our primary count is posted on the SPX/DOW charts, since our bellwether index for the US is the DOW. This count suggests the March-May uptrend to SPX 1371 was Intermediate wave one of Major wave 3, and the recent May-June downtrend to SPX 1258 was Intermediate wave two. The current uptrend should then be Intermediate three, of Major 3, of Primary III. The mid-point, in wave structure, of the bull market.
MEDIUM TERM: uptrend
We noted last week the weekly RSI was the most oversold it had been since the bull market began, (see chart above). We also noted about two weeks ago the correction had changed character, in that it had not made a lower low (SPX 1258) after the gap up opening on June 17th. And then it had its biggest rally since the correction began: 41 points to SPX 1299. Most of that rally was retraced by June 23rd when the SPX hit 1263. But it held the SPX 1258 low, started to rally again, and took out the 1299 previous rally high on June 29th. Near week’s end a new uptrend was confirmed, along with a WROC buy signal – the first since early July 2010. These buy signals usually lead an uptrend confirmation, this one was coincident, and multiple signals suggest a very strong uptrend.
On the technical front. Eight of the nine SPX sectors are in confirmed uptrends. They were all in downtrends recently. The NYAD, market breadth, has already made a new bull market high. Copper is uptrending, the VIX is downtrending, Bonds are downtrending, Crude appears to have bottomed, and the USD appears to have topped, (the EUR is already uptrending). Also, seven of the fourteen foreign indices we track are now in confirmed uptrends. They were all in downtrends recently as well.
We are counting this uptrend as a five Minor wave Intermediate wave three. Minor waves 1 and 2 appear to have already completed at SPX 1299 and 1263 respectively. Minor wave 3 is underway now. Since Intermediate wave one ended at SPX 1371, Intermediate wave three has to rally much above that to prevent an Intermediate wave four, (the next downtrend), from overlapping Intermediate wave one. We would expect this uptrend to clear the OEW 1363, 1372 and 1386 pivots and then hit the SPX 1440 pivot before it ends. This would allow for a minor 4% – 5% correction, Intermediate wave four, to occur around September/October.
SHORT TERM
Support for the SPX is at 1313 and then 1303, with resistance at 1363 and then 1372. Short term momentum remains extremely overbought. There is some short term resistance right at the current level: between SPX 1339 and 1345. These levels created resistance at the February uptrend high, the early April high, and the late May high. With short term momentum (RSI) at 94% and the hourly MACD well over 10, a pullback of 10 or more SPX points would help reset these indicators.
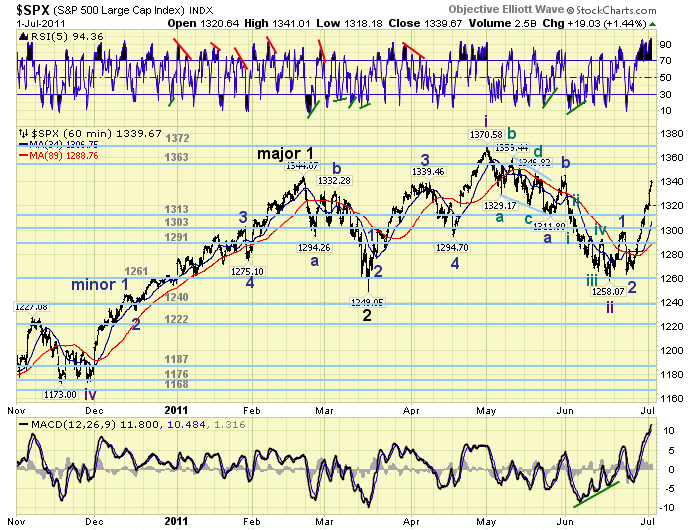
Looking a little further out. Minor wave 1 rallied from SPX 1258 to 1299. Minor wave 2 pulled back to SPX 1263. At the OEW 1371 pivot Minor wave 3 would be 2.618 times Minor wave 1. So we could get a small pullback from around current levels, and then a larger pullback around the bull market high for a Minor wave 4. After that Minor wave 5 should take the market to new bull market highs, and up to the OEW 1440 pivot.
As a cautionary note. Should this market pullback to the 1313 pivot, the 1303 pivot, and then overlap SPX 1299, a correction process from the February SPX 1344 high may still be in progress. Best to your trading!
FOREIGN MARKETS
The Asian markets were all higher on the week for a net gain of 1.6%. The Nikkei is in a confirmed uptrend and the other four appear to have bottomed.
The European markets were all substantially higher for a gain of 5.2%. Four of the five indices we track are in confirmed uptrends.
The Commodity equity group were all higher for a net gain of 3.8%. The RTSI is in a confirmed uptrend and the other two appear to have bottomed.
The DJ World index is uptrending and gained 5.1% on the week.
COMMODITIES
Bond prices confirmed a downtrend this week losing 2.3%. The 10YR yields are uptrending from the recent low of 2.85%: currently 3.2%.
Crude (+3.6%) appears to have ended its downtrend within the support range posted on the daily chart. There is a large positive divergence at the recent low. No uptrend confirmation yet.
Gold lost 1.2% this week as it continues its correction from the late April high. Support is around the $1450 area.
The USD lost 2.1% on the week and the recent uptrend appears to have topped. The EUR (+2.4%) is already in a confirmed uptrend.
NEXT WEEK
Monday is a holiday in the US. Tuesday Factory orders will be reported at 10:00. On wednesday we have the ADP index and ISM services. Then on thursday weekly Jobless claims. On friday the monthly Payrolls report, Wholesale inventories and Consumer credit. The FED has nothing scheuled at this time. Best to your extended weekend and week!
CHARTS: http://stockcharts.com/...
http://caldaroew.spaces.live.com
After about 40 years of investing in the markets one learns that the markets are constantly changing, not only in price, but in what drives the markets. In the 1960s, the Nifty Fifty were the leaders of the stock market. In the 1970s, stock selection using Technical Analysis was important, as the market stayed with a trading range for the entire decade. In the 1980s, the market finally broke out of it doldrums, as the DOW broke through 1100 in 1982, and launched the greatest bull market on record.
Sharing is an important aspect of a life. Over 100 people have joined our group, from all walks of life, covering twenty three countries across the globe. It's been the most fun I have ever had in the market. Sharing uncommon knowledge, with investors. In hope of aiding them in finding their financial independence.
Copyright © 2011 Tony Caldaro - All Rights Reserved Disclaimer: The above is a matter of opinion provided for general information purposes only and is not intended as investment advice. Information and analysis above are derived from sources and utilising methods believed to be reliable, but we cannot accept responsibility for any losses you may incur as a result of this analysis. Individuals should consult with their personal financial advisors.
© 2005-2022 http://www.MarketOracle.co.uk - The Market Oracle is a FREE Daily Financial Markets Analysis & Forecasting online publication.