


Dow-to-Gold and Greece-to-Gold
Commodities / Gold and Silver 2011 Jul 23, 2011 - 03:56 PM GMTBy: Willem_Weytjens

 In this article we will discuss different ratios, including the important DowJones-to-Gold ratio, but also a special ratio which we will discuss below.
Let’s start with the DowJones-to-Gold ratio.
When you see the following chart, you will probably be convinced that the Dow-to-Gold ratio has a long way to go before bottoming. Since 1900, the ratio has often fallen below 3. It even dropped as low as 1 in 1980:

Source: Fred’s Intelligent Bear Site
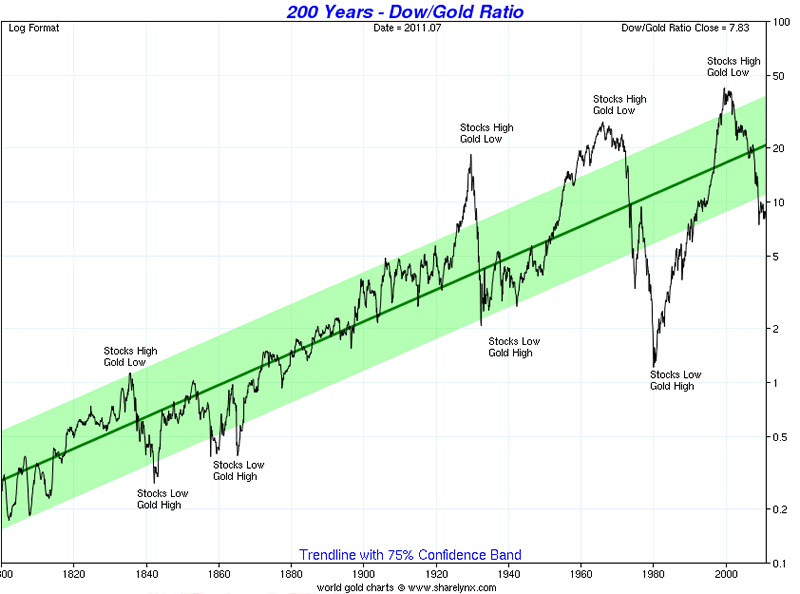
However, when we look at the ratio since 1800 (yes, that is more than 200 years of data!), we see a completely different picture.
We can clearly see that the ratio is in an uptrend over the long term. This means that, over the long term, stocks have outperformed gold big time. The ratio has now dropped below the green zone (just like it did 3 times in the mid-1800′s), which looks like a long-term trend zone.
Source: Sharelynx
When we look at the medium term, we can see that a huge bubble in stocks was created in the late 1990′s. However, that bubble burst in 2000-2001, and stocks have underperformed gold ever since. The blue line looks to provide support right now, although the bottom may fall out at anytime. Stock bulls may argue that the ratio now broke out above the red resistance line. Who is right?
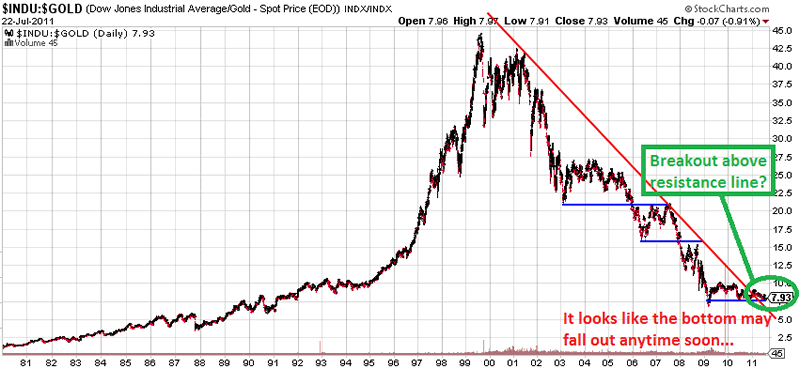
Chart courtesy stockcharts.com
Assume that the stock bulls are right, would you buy the SP500 now?
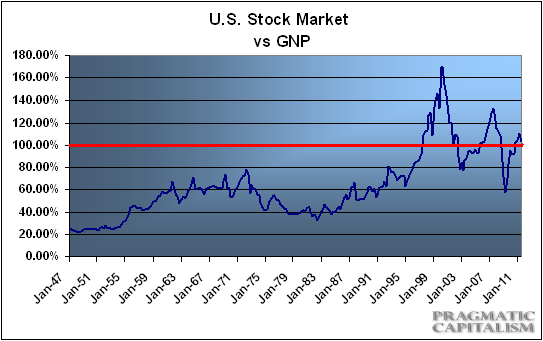
Think about what Warren Buffett said: he prefers to see this metric (which measures the US Market Capitalization to the Gross National Product) at 70%-80% before buying equities:
“For me, the message of that chart is this: If the percentage relationship falls to the 70% or 80% area, buying stocks is likely to work very well for you. If the ratio approaches 200%–as it did in 1999 and a part of 2000– you are playing with fire.”
Source: PragCap
It’s not at peak levels, but compared to historical levels, the metric is very high again.
But does that mean that markets all over the world are trading at high levels? NO. One market that has fallen dramatically of course is Greece… Greek stocks are trading at their lowest level since 1997:
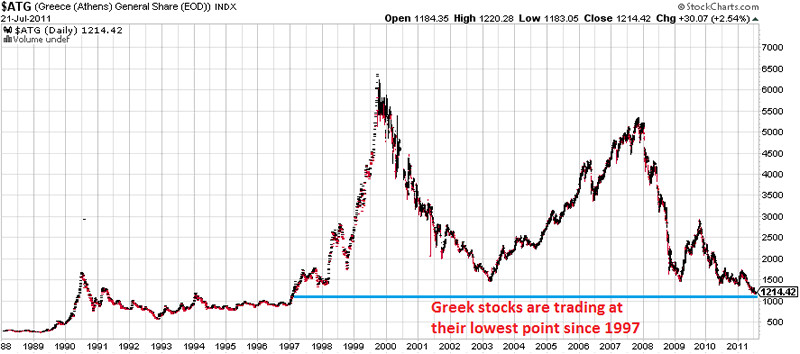
Chart courtesy stockcharts.com
Let’s see how Greek stocks have performed compared to the SP500 for example.
This ratio is at the lowest point since at least 1989. It topped twice around 4.75, and is now below 0.90.
So if you are a stock bull and think the crisis will be solved at some point (or that the worst of the Greek Debt crisis is behind us or that the US are next), I think it’s safe to assume that the ratio will climb again, meaning Greek stocks should outperform American stocks.
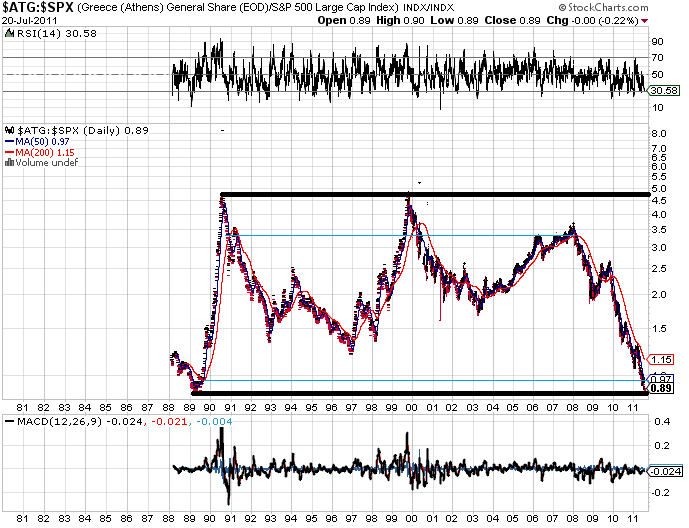
Chart courtesy stockcharts.com
Now let’s have a look at the performance of Greek stocks compared to Gold.
We can see that the ratio is approaching the 1988 low of 0.61.
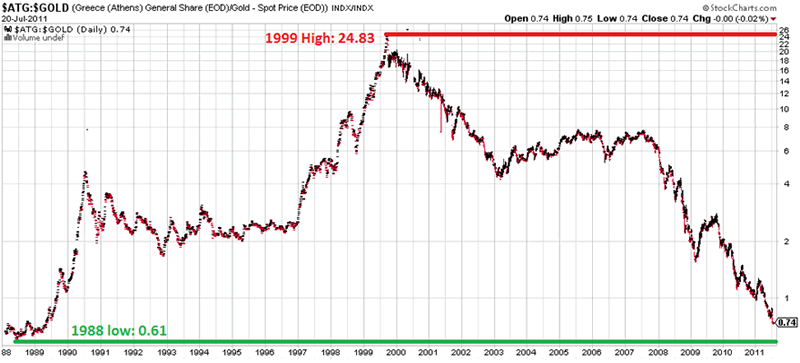
Chart courtesy stockcharts.com
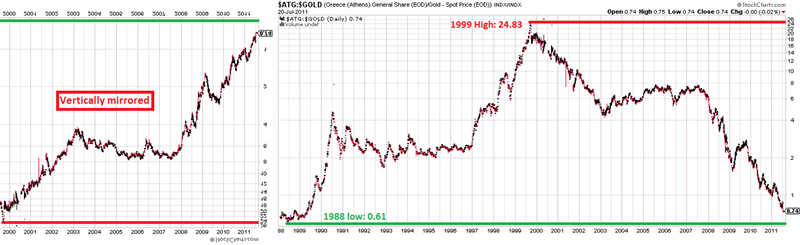
More interestingly however, is the fact that the move down from 1999 to today is very similar to the move up from 1988 until 1999 when we mirror it vertically.
Let me show you with an illustration. The left part is the move down from 1999 to today but mirrored vertically. The right part of course, is the GreekStocks-to-gold ratio. Compare the left part to 1988 until 1999. It looks similar, doesn’t it?
For those of you who don’t see the similarities, I moved the first chart on top of the other:
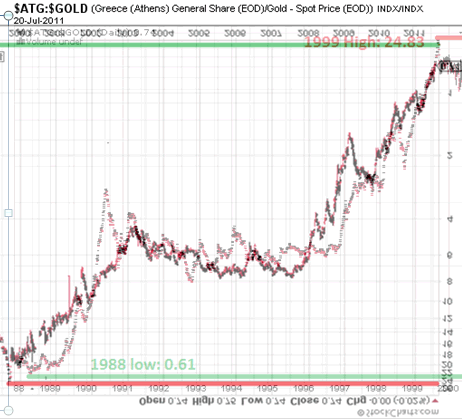
On an historical basis, Greek stocks look cheap to gold. However, the data only goes back until 1988, and does not include the parabolic rise of gold in 1979-1980.
Greek stocks also look cheap compared to American stocks, based on the charts above.
The biggest danger to investing in Greek stocks however, is if Greece would decide to step out of the Euro and go back to the Drachma, which would probably imply a big depreciation of the currency and thus your investments.
For more analyses and updates, please visit www.profitimes.com
Please also read our post from a couple of days ago, in which we compared the gold price to the Nikkei Bubble (Click HERE to read it), and our Special report about the US Housing Market, Stock market, Commodities, Interest Rates and Debt Levels which you can read HERE.
Willem Weytjens
www.profitimes.com
© 2011 Copyright Willem Weytjens - All Rights Reserved
Disclaimer: The above is a matter of opinion provided for general information purposes only and is not intended as investment advice. Information and analysis above are derived from sources and utilising methods believed to be reliable, but we cannot accept responsibility for any losses you may incur as a result of this analysis. Individuals should consult with their personal financial advisors.
© 2005-2022 http://www.MarketOracle.co.uk - The Market Oracle is a FREE Daily Financial Markets Analysis & Forecasting online publication.