


Gold Short-term Uncertainty But Long-term Bullish
Commodities / Gold & Silver Dec 03, 2007 - 12:15 AM GMTBy: Merv_Burak
 Well, Friday was five in a row. We had two previous five in a row down days this year. One was followed by a reasonable rally while the other was followed by a lateral move which then morphed into the Aug to Nov rally. Is there a rally ahead?
GOLD
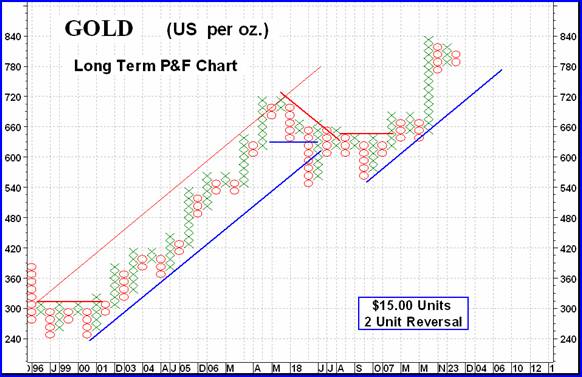
After hitting its first two targets ($780 and $840) gold is taken a breather. The Aug to Nov rally has left behind it two more targets yet to come, the next at $915 and then to $1125. For those to stay valid gold must not give a bear signal on the long term P&F chart. At the present time, without any further ups and downs, that signal would come on a move to the $630 level, some distance away. However, I would expect the action to cause more ups and downs with a resulting higher reversal signal level. For now the P&F is still comfortably BULLISH, long term wise.
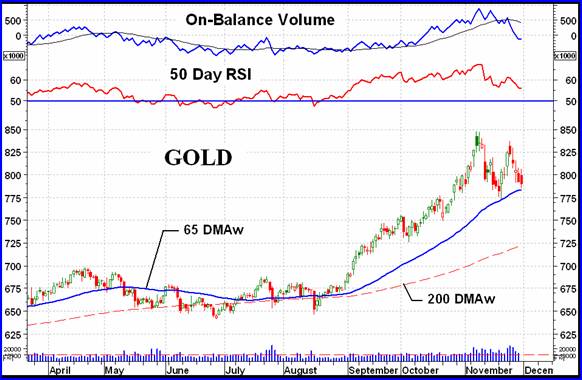
As for the usual charts and indicators, they also are comfortably inside their positive zones. The Index action is still well above a positive sloping long term moving average line and the momentum indicator is comfortably in its positive zone. However, and there is so often a however, the momentum indicator is giving us a warning of underlying weakness in the recent price action. Although gold is still above its low of a few weeks ago the momentum indicator has moved below its low previous levels. It is moving lower ahead of the price giving us a warning for the continuation of downside action. Now we know that nothing goes in one direction for long without some reversal action coming to play, but what the momentum is telling us at this point is that any reversal will be short lived. Volume is also a problem but I will cover it in the next section.
Despite the weakness this past week and the potential for more, the indicators require a BULLISH long term rating until validated otherwise.
INTERMEDIATE TERM
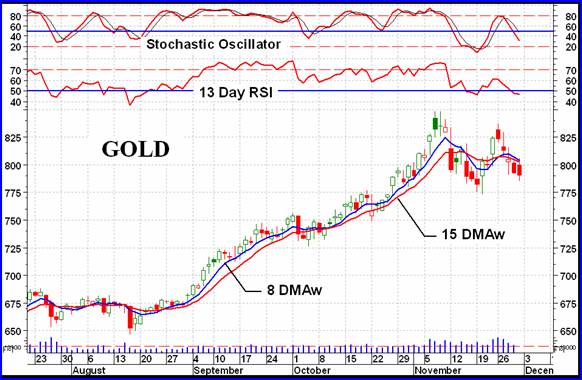
A nasty week but the price still has not breached the intermediate term moving average line, and the line is still pointing upward. As with two weeks ago the price seems to have stopped just above the line. As with the long term, the intermediate term momentum indicator is still comfortably above its neutral line but is showing warnings of weakness. The Friday close has the indicator just below its Mid-November low ahead of the price making a similar low. The momentum indicator is now where it was just at the start of the rally in early September.
The volume indicator is the one giving us the most trouble. November has seen the daily volume level consistently quite high, above the 100,000 mark almost every day. However, that volume did nothing for the price and the volume indicator is now plunging, indicating more and more of this volume is going to the down side. Not a good sign at all. With the moving average and momentum I would still be inclined to rate the intermediate term as bullish or at worst, + neutral but if we add in the activity of the volume then I must downgrade the rating to at best, NEUTRAL.
SHORT TERM
After five down days in a row I guess that the down side is the established short term trend, but will it continue? We have had five in a row down days twice this past year. The first time it was followed by a decent rally. The second time we had these five in a row days that was followed by a lateral trend which eventually led to the August to Nov rally. I don't expect the same situation although I do expect a possible short term rally ahead. We seem to be going through a period of roller coaster price activity. As mentioned last week, there are two levels to watch, the $773 and $848 levels. Until one or the other is breached we can expect more up and down markets. Whichever one does get breached, and one will sooner or later, should tell us the next market direction for some time.
For now all the indicators are on the down side so as far as the short term rating is concerned I must go with the BEARISH rating until the action once more reverses itself.
NORTH AMERICAN GOLD INDICES
Well, we're back to the S&P/TSX Global Gold Index. It's a “global” Index because a few of the companies are headquartered outside of North America (primarily South Africa ) but all of the component stocks are North American traded issues. This Global Index has two features that may not be present in the other four Gold Indices that are followed here every week. First, although the Index does place greater weight on the larger companies towards the Index value calculation, that weighting is “capped” so as not to give one stock too great of an influence. Second, the Index uses Canadian stocks to a great extent and therefore there is a currency variation that comes into play. As an example, from its low in early February to its high in early November the Canadian Dollar rose 30% versus the US Dollar. That's gotta hurt when the Index is calculated in Canadian currency while the other Indices are calculated in US $. That 30% currency rise has to be reflected in the Index calculation, versus the other Indices.
One can see the effect of the rising Canadian Dollar during the rally period of August to November. The Global Index had a much lower performance than did the other Indices. However, the trend and indicators should still be able to tell us something that may be applied to the other Indices.
We have an Index with all the earmarks of one that is going through a topping activity. For months it has been able to go nowhere but laterally. We have the past three months where the Index has been trending slightly higher BUT the momentum indicator was trending sideways. The action to watch would be the action as the Index closes in on the 200 DMAw line. A breach below that line may signal much lower levels to come.
MERV'S PRECIOUS METALS INDICES
We've had some interesting performances in the various Merv's Indices. As you might have noticed in the media during the week, there were two stocks going in opposite directions. NovaGold plunged on the news that it has scrapped its major project and Canplats zoomed on publication of some drill results. Both had a major impact on their respective Sector Indices. I will get into that later. For now suffice it to say that it was not a good week for the Indices (or stocks). Except for the Gamb-Gold Index, which I will get to later, all the other Indices had major declines, as had the North American majors.
MERV'S GOLD & SILVER 160 INDEX
The overall universe of 160 stocks had an average loss of 3.5% on the week. However, two stocks had extraordinary performances during the week of a kind rarely seen. If we subtract these two performances we would have had an average decline of 5.3%, which is in line with most of the other Indices. It is rare for a single stock to have an appreciable effect on the Index calculation but it happens (very, very rarely). Of more significance are the winners and losers during the week. There were 24 winners (15%) and 134 losers (84%). Two stocks remained unchanged.
That is more than a 5 to 1 ratio of losers to winners and shows a very negative week indeed. Despite all this negativity there were only three stocks that made it i9nto my speculative over/under 30% weekly movers list, one up and two down. As one can expect, the weekly action did not help the summation of individual stock ratings. None of the three time periods are rated as bullish. The short term has an 87% BEAR rating, the intermediate term has a 60% BEAR rating and the long term has neither a bull nor a bear rating that is over the 50% mark and is considered as NEUTRAL .
As for the charts and indicators, although we have had five days in a row of gold price downside closed we are now at 4 weeks in a row of Index downside closes. The Index closed below both the intermediate and long term moving average lines and both lines are now pointing downward. Both momentum indicators are pointing lower but only the intermediate term momentum indicator has already entered its negative zone. The long term indicator is just above its neutral line. Both the intermediate and long term are rated as BEARISH .
MERV'S QUAL-GOLD INDEX : MERV'S SPEC-GOLD INDEX : MERV'S GAMB-GOLD INDEX
The Qual and Spec-Gold Indices both closed lower by 5.5% while the Gamb-Gold Index closed higher by 7.7%. The Qual-Gold Index was skewed towards the negative while the Gamb-Gold Index was skewed towards the positive, due to the actions of only one component stock in their respective Indices. If we deleted that one stock in each Index we would have the Qual-Gold Index at a loss of only 3.9% (versus 5.5%) and the Gamb-Gold Index would have shown a loss of 3.6% (versus a gain of 7.7%).
I have often maintained that a stock trading activity will highlight something happening in the stock ahead of a major move, MOST OF THE TIME. As far as Canplats was concerned, it had indicated something happening since Oct 22 when it first made its move. It has been rated as technically POS ever since. As for NovaGold, that is one of the rarities that DID NOT broadcast its problems ahead of time in the daily stock activity. Up to the last day before the news the stock price had been in a bullish trend and had been technically rated as POS. This is a good example that one should always have his exit strategy in operation just in case of unforeseen events, although in this case it still might have been too late to do much good.
As we see, one stock can skew an Index value so there are other indicators we look at to confirm the Index move. One indicator is the advancing and declining issues. A single stock cannot “skew” these results. For the Qual-Gold Index we had 5 stocks on the advance (17%) and 25 stocks on the decline (83%). For the Spec-Gold Index we had 3 stocks on the advance (10%) and 26 stocks on the decline (87%). For the Gamb-Gold Index we had 8 stocks on the advance (27%) and 22 stocks on the decline (73%).
Another of the “breadth” indicators is the summation of ratings of the Index component stocks. The following are the results of such summations.
Qual-Gold Index: Short term BEAR 85%, intermediate term BEAR 53%, and long term BULL 70%.
Spec-Gold Index: Short term BEAR 83%, intermediate term BEAR 62% and long term BEAR 52%.
Gamb-Gold Index: Short term BEAR 80%, intermediate term BULL 52% long term BULL 80%.
Lastly we look at the charts and indicators to see what they are telling us. We have an Index that is above a positive moving average for the following: Qual long term and Gamb intermediate and long term. We have an Index that is below its negative moving average line for the following: Qual intermediate term, Spec intermediate and long term. We have a momentum indicator that is in its negative zone and heading lower for the intermediate term Spec Index. All other Indices and time periods have a momentum in its positive zone with a positive slope for the Gamb Indices and a negative slope for the other Indices.
Putting all that together we have three BULLISH ratings, Qual long term and Gamb intermediate and long term, and three BEARISH ratings, Qual intermediate term and Spec intermediate and long term.
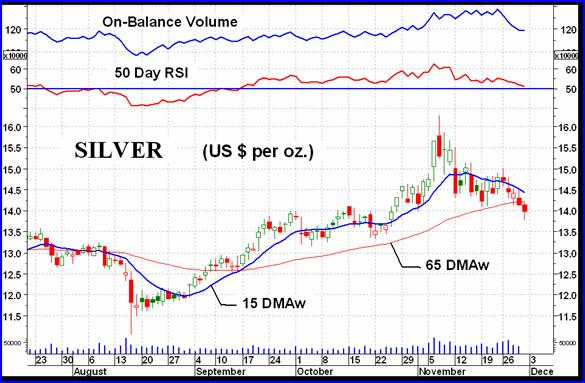
SILVER
Silver continues to under perform gold. Where gold is still above its previous mid-November lows silver has handily breached its lows and moving lower. While the short term momentum indicator is already in its negative zone the intermediate term indicator has not quite gone negative. It's just above its neutral line. The short term moving average line has been negative for a few weeks now and continues to head lower.
The action on Friday seems to suggest that silver just might be ready for a little bit of a rally. If so, I would not yet raise hopes of a significant one.
Support seems to lie at around the $13.25 level so let's see what happens there if the negative trend continues.
MERV'S QUAL-SILVER INDEX : MERV'S SPEC-SILVER INDEX
With these two Indices we have performances at both ends of the scale (excepting for the Gamb-Gold Index). The Qual-Silver Index lost only 3.1%, the lowest loss of the Merv's Indices. The Spec-Silver Index lost 6.9%, the worst of the Merv's Indices. One might have expected a bigger loss for the Qual Index when compared to silver bullion but that's the way it goes sometimes.
The Qual-Index had only one advancer (10%) and 9 decliners (90%). The Spec-Index had 4 advancers (16%) and 21 decliners (84%).
As for the summation of ratings, they went as follows:
Qual-Silver: Short term BEAR 80%, intermediate term BULL 50%, long term BULL 60%.
Spec-Silver: Short term BEAR 90%, intermediate term BEAR 60%, and long term NEUTRAL (neither bull nor bear with 50% or more in summation of ratings).
As for the charts and indicators, the Qual-Silver Index is still above its positive long term moving average line but below a positive intermediate term line. The Spec-Silver Index is below negative sloping moving average lines for both time periods. As for the momentum indicators, we have negative sloping indicators all around with the intermediate term indicator already below its neutral line and the others still above the neutral line.
Putting all this together I would give the Qual long term rating as a BULLISH rating and the intermediate term as a – NEUTRAL rating. As for the Spec-Silver Index, a BEARISH rating for both time periods.
Merv's Precious Metals Indices Table
Well, that's it for another week.
By Merv Burak, CMT
Hudson Aero/Systems Inc.
Technical Information Group
for Merv's Precious Metals Central
Web: www.themarkettraders.com
e-mail: merv@themarkettraders.com
Before you invest, Always check your market timing with a Qualified Professional Market Technician
For DAILY Uranium stock commentary and WEEKLY Uranium market update check out my new Technically Uranium with Merv blog at www.techuranium.blogspot.com .
During the day Merv practices his engineering profession as a Consulting Aerospace Engineer. Once the sun goes down and night descends upon the earth Merv dons his other hat as a Chartered Market Technician ( CMT ) and tries to decipher what's going on in the securities markets. As an underground surveyor in the gold mines of Canada 's Northwest Territories in his youth, Merv has a soft spot for the gold industry and has developed several Gold Indices reflecting different aspects of the industry. As a basically lazy individual Merv's driving focus is to KEEP IT SIMPLE .
To find out more about Merv's various Gold Indices and component stocks, please visit www.themarkettraders.com and click on Merv's Precious Metals Central . There you will find samples of the Indices and their component stocks plus other publications of interest to gold investors. While at the themarkettraders.com web site please take the time to check out the Energy Central site and the various Merv's Energy Tables for the most comprehensive survey of energy stocks on the internet. Before you invest, Always check your market timing with a Qualified Professional Market Technician
Merv Burak Archive |
© 2005-2022 http://www.MarketOracle.co.uk - The Market Oracle is a FREE Daily Financial Markets Analysis & Forecasting online publication.