


S&P’s Downgrade of U.S. Sovereign Debt – Some People Actually Pay Them for these Opinions?
Interest-Rates / Credit Crisis 2011 Aug 09, 2011 - 02:58 AM GMTBy: Paul_L_Kasriel

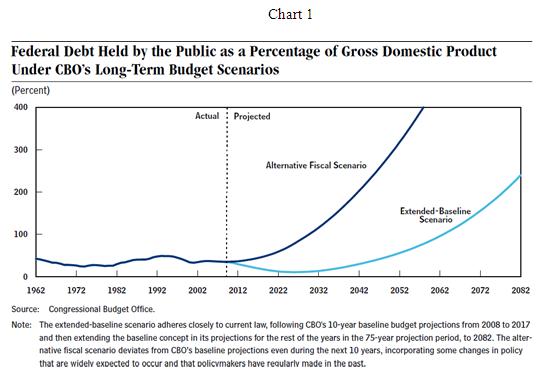
 S&P stated the obvious after the U.S. markets closed on August 5 – the projected growth in U.S. public debt is on a long-term unsustainable path. Rather than paying S&P for this opinion, all you need to do is look at some past CBO projections and you would have arrived at the same opinion years ago. For example, in December 2007, CBO published the chart immediately below showing its projections of U.S. public debt held by the public as a percent of nominal GDP under two scenarios. The first scenario, the “extended-baseline” scenario, assumed that the federal spending and revenue budgetary legislation that was on the books as fiscal 2007 would prevail over the next 75 years.
One important element of that legislation was that the personal marginal income tax rate structure would return to its 2000 level on January 1, 2011. Under the extended-baseline scenario, U.S. public debt relative to GDP, which was 37% at the end of fiscal 2007, drops to 25% of GDP by the end of fiscal 2025. By 2045, however, debt held by the public rises back to 37% of GDP and to 239% of GDP by 2082. The second scenario, the “alternative fiscal” scenario, assumes, among other things, that the personal marginal income tax rates that prevailed at the end of fiscal 2007 would continue to prevail throughout the 75-year projection period. Under the alternative fiscal scenario, debt held by the public keeps rising from the 37% of GDP at the end of fiscal 2007 and reached 109% of GDP by fiscal 2031 – matching the previous high percentage set at the end of World War II. Things go from bad to worse thereafter. Under either scenario, then, the projected paths of U.S. public debt were unsustainable in long run. So, back in December 2007, actually years before that, without the expert opinion of S&P, you could have known that the U.S. fiscal environment was on a long-run unsustainable course.
Now these CBO projections did not necessarily mean that the actual values of debt to GDP would occur. Legislation could be passed and enacted into law that would change the U.S. federal budgetary course to avoid the economic maladies that would occur otherwise. Granted, the recent political difficulty in passing legislation that calls for only a modest reduction in the projected growth in the public debt is not encouraging with regard to “bending the debt curve” to a sustainable path. That is the reason given by S&P to go ahead with their one-notch downgrade of U.S. debt last Friday. But I reiterate that the unsustainable path on which U.S. public debt is on has been known for years. And the unsustainable debt projections have continued for years, as any thinking person would know (and this even includes bond traders) because the politics of changing this projected course are difficult. This is not new news.
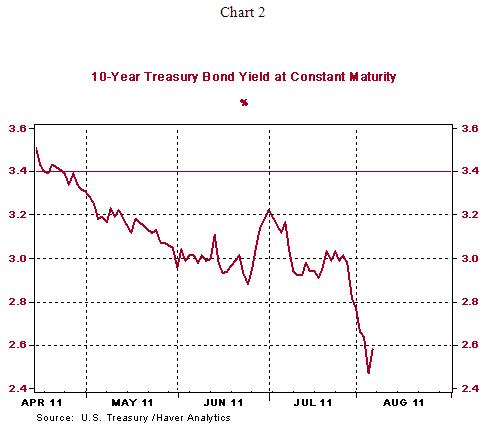
Speaking of bond traders, they have been bidding up the price of U.S. Treasury bonds since S&P issued its negative watch on U.S. sovereign debt on April 18, 2011. The chart below shows the yield on the 10-year U.S. Treasury yield has fallen from 3.40% on Monday, April 18, to 2.58% on Friday, August 5. As this is being written on Monday morning, August 8, the first business day after the announcement by S&P of its U.S. debt downgrade, the Treasury 10-year security is trading at a yield of 2.39%. Probably the only entity more frustrated than S&P for not heeding their opinion on U.S. debt is PIMCO!
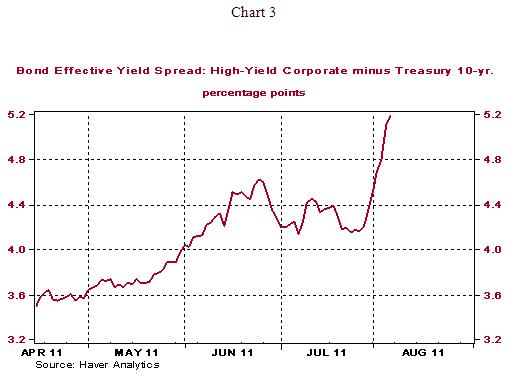
Interestingly enough, since S&P put U.S. sovereign debt on a negative watch in mid April, it has been U.S. private debt that seems to have been adversely affected by default risk. As the chart below shows, since April 18 through August 5, the yield spread between high-yield corporate bonds and U.S. Treasury 10-year securities has widened by 157 basis points. So, all those talking heads on cable television who said that your borrowing costs would go up if U.S. sovereign debt were downgraded might have been right – right, but for the wrong reason.
Paul Kasriel is the recipient of the 2006 Lawrence R. Klein Award for Blue Chip Forecasting Accuracy
by Paul Kasriel
The Northern Trust Company
Economic Research Department - Daily Global Commentary
Copyright © 2011 Paul Kasriel
Paul joined the economic research unit of The Northern Trust Company in 1986 as Vice President and Economist, being named Senior Vice President and Director of Economic Research in 2000. His economic and interest rate forecasts are used both internally and by clients. The accuracy of the Economic Research Department's forecasts has consistently been highly-ranked in the Blue Chip survey of about 50 forecasters over the years. To that point, Paul received the prestigious 2006 Lawrence R. Klein Award for having the most accurate economic forecast among the Blue Chip survey participants for the years 2002 through 2005.
The opinions expressed herein are those of the author and do not necessarily represent the views of The Northern Trust Company. The Northern Trust Company does not warrant the accuracy or completeness of information contained herein, such information is subject to change and is not intended to influence your investment decisions.
Paul L. Kasriel Archive |
© 2005-2022 http://www.MarketOracle.co.uk - The Market Oracle is a FREE Daily Financial Markets Analysis & Forecasting online publication.