


Are Gold and the Stock Market Behaving Logically or Irrationally
Stock-Markets / Financial Markets 2011 Aug 18, 2011 - 12:05 PM GMTBy: J_W_Jones

 Back on August 7th the S&P 500 was in the midst of a panic induced selloff and the bulls were running scared. Prices were collapsing and the bulls were racing to the exits. In the following weeks, piles of money flew out of equity mutual funds as the retail investors rang the register and pulled their money out near the lows which seems to be a regularly recurring event.
While most market participants were clearly panicking, I was sitting back watching the market push lower with complete focus on being ready to initiate long positions near the lows. I sent out multiple warnings to members of my service to raise cash and reduce risk. I sat in cash and watched the madness unfold in real time.
Admittedly I did not expect the selloff to be as severe as it was and unfortunately I did not get involved with any short exposure. However, my focus is always forward looking and opportunities will present themselves again and protecting my trading capital is always my primary focus.
My article that went out August 8th was focused on downside momentum in the marketplace as well as key areas where I expected price action to hold at support. I was expecting the S&P 500 to find support around the 1,130 price level. I will be the first one to admit I am not one for making bold predictions, but I’m not scared to identify key long term support levels which have the tendency to mark bottoms in price action.
While price ultimately undercut my 1,130 target price level on the S&P 500, the following day a giant reversal bar formed which captured my interest and on August 10th I entered long positions with tight stops below the recent lows and members and I were quickly rewarded. I closed the remainder of the trade today and locked in a 32% return based on maximum risk in essentially 1 week using a basic option strategy which levered up my position.
Now I find myself with very little exposure and I’m pondering what to do. First of all, a quick glance at the short term momentum charts illustrates that price action is still extremely oversold. However, oversold conditions could worsen further potentially. The chart below illustrates the amount of stocks trading above their 20 period moving averages:
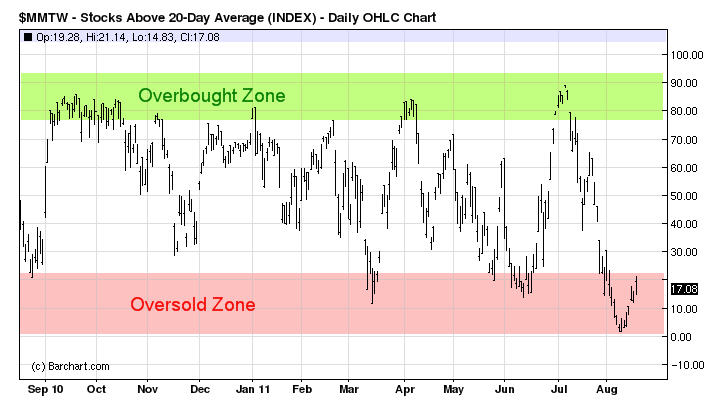
It is obvious that price action in the S&P 500 is clearly oversold and equities have considerable room to rally. However, I would point out that oversold conditions can be worked off as function of the passage of time and not just higher prices. I continue to believe that we will see the S&P 500 test the 1,220 price level and will likely move on to the 1,250 area. If price action can work above the 1,250 price level the neckline of the head and shoulders pattern will act as a key resistance area. The daily chart of the SPX is shown below:
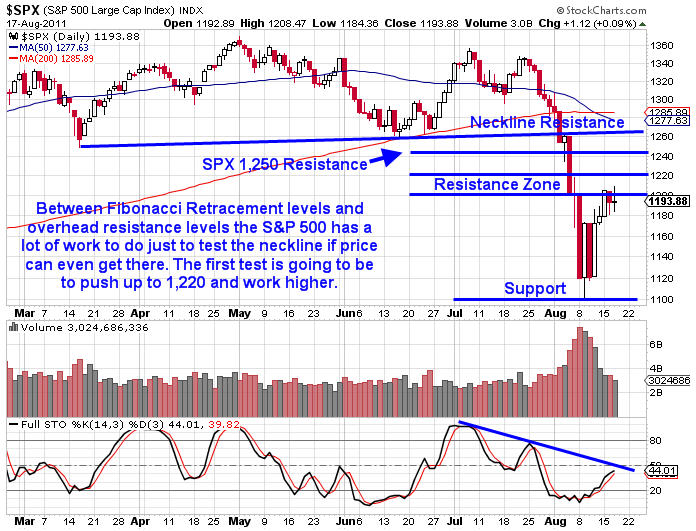
The key levels outlined correspond with major support areas that are either carved out by previous pivot lows or through Fibonacci retracement levels. At the very least, I expect price action in the S&P 500 index to test near the 1,220 price level as it will mark a .500 Fibonacci retracement area.
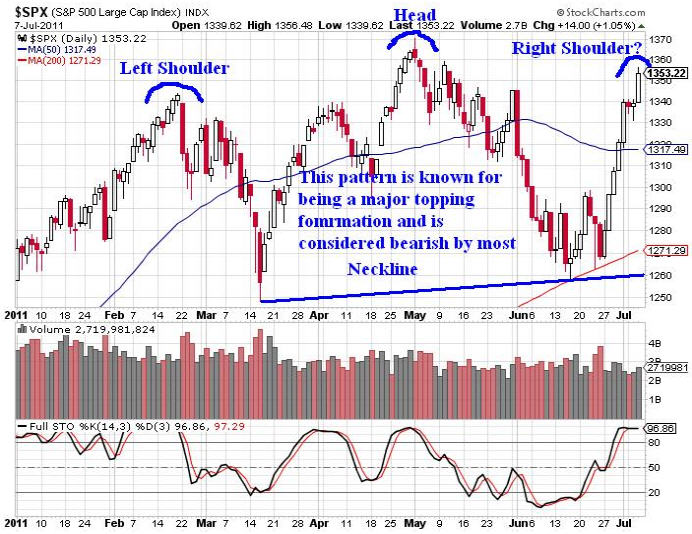
I would not be at all shocked to eventually see the neckline of the head and shoulders pattern backtested to verify resistance. The head and shoulders pattern that helped propel prices lower is clear when looking at the weekly chart. I first wrote about the pattern back on July 8th and presented the following chart:
It is entirely plausible that Mr. Market thrusts lower from here to shake out longs. If that scenario plays out it could potentially carve out a double bottom or another basing pattern which would give active traders another entry point to get long. I think we are weeks from having a possible test of the recent lows on the S&P 500 as it is going to take the broad marketplace quite a while to digest the selloff and work off oversold conditions as a function of time and/or price.
Price action would be healthier if we pulled back a bit here before attempting to attack the resistance at the key 1,200 price level on the S&P 500. If prices continue to race higher in a short period of time I would consider the price action to be more of a warning that lower prices are around the corner.
While anything could happen, I believe that the S&P 500 will test the recent lows which need to hold desperately. I want to be a bull very badly, but right now unfortunately I cannot be bullish because a variety of indicators and analysis suggests that lower prices may await us.
By now most readers recognize the monster bull market that gold and silver have enjoyed for nearly a decade. I do not intend to provide a history lesson, but during the last equity selloff investors and traders alike fled to Treasuries and the yellow metal for safety while nearly every other asset class sold off. Gold put in a new all time high on August 11th and price quickly sold off.
Since then we have seen gold climb back up and at this point in time it appears to be poised to test the recent highs. Some market pundits say gold is in a bubble while others say prices will work higher. In my estimation as long as the Federal Reserve has loose monetary policy gold prices will continue higher over the long term. At this point in time it does not appear likely that the Federal Reserve will tighten monetary policy until after the election at the very earliest.
Instead of arguing the economics behind gold prices and the inflation/deflation debate, I am more interested in where price action may be headed. At first glance on the daily chart of gold futures it could be said that gold has accelerated significantly higher in a short period of time. There are plenty of traders that believe gold has gotten ahead of itself and desperately needs a strong correction to shake out weak ownership.
Interestingly enough these same traders and investors have been calling for a major selloff in gold for quite some time. While I have written about coming corrections, I have always maintained a long term bullish stance on gold and silver due to the Federal Reserve’s current monetary policy.
Yet again, I find myself expecting to see gold selloff in what could play out as a double top on the daily chart. I am going to be watching the price action closely looking for a possible entry to take advantage of lower prices. At the same time, I am not willing to go charging in until I see some confirming signs that gold prices will head lower.
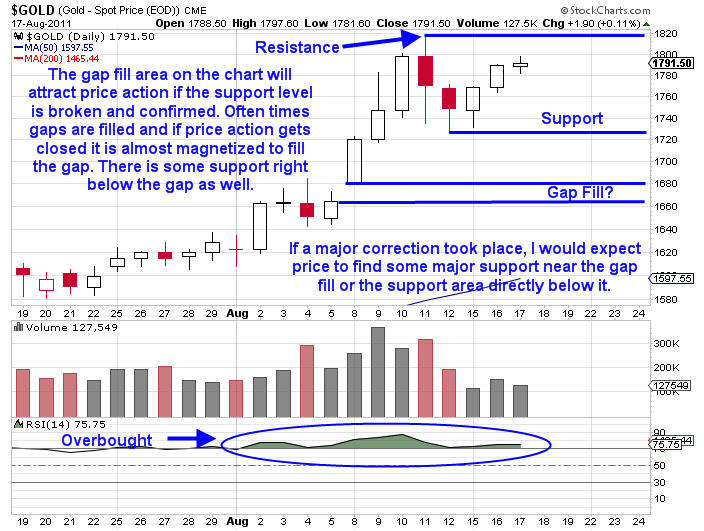
If gold prices push above the recent highs with additional momentum gold will trade higher yet. The next few days should be very telling as a large move could be setting up in the yellow metal in the near term. The daily chart of gold is shown below:
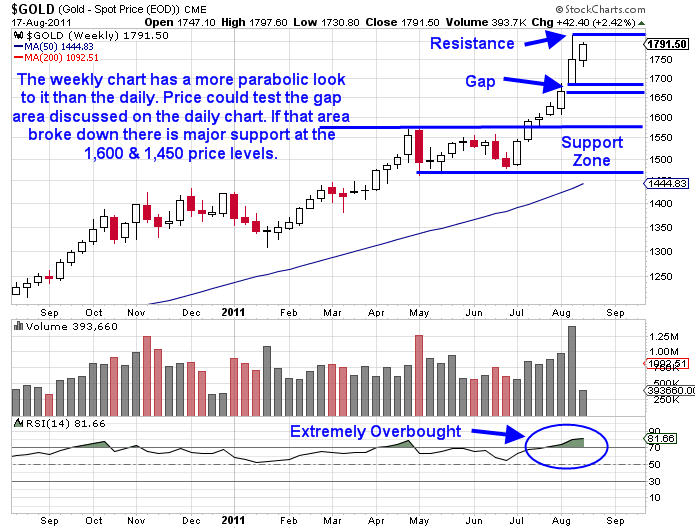
While the daily chart clearly illustrates the potential for a double top to emerge, the weekly chart has a more parabolic look to it. If a significant correction in the price of gold sets up for traders to take a longer term short trade, then a major reversal or topping pattern should come into focus in the next few weeks.
While a short term trade to take advantage of lower prices in gold might produce some fast money, longer term traders need to be patient and let gold confirm lower prices before getting involved. The weekly chart of gold is shown below:
Ultimately I do believe we need to see a healthy pullback in gold that works off some of the overbought conditions that are present in the price action. If investors continue to view gold as a safety trade it is obvious that prices could continue higher based on uncertainty coming out of the sovereign debt crisis going on in Europe. As of right now, it appears gold could go either way but probability favors the downside.
Logically it would make sense that if the S&P 500 rallied gold would selloff. Unfortunately Mr. Market rarely embarks upon the logical until he has convinced enough market participants to behave irrationally. It should be interesting to see what Mr. Market has up his sleeve this time.
Take a look at www.OptionsTradingSignals.com/specials/index.php today for a 24 hour 66% off coupon.
J.W. Jones is an independent options trader using multiple forms of analysis to guide his option trading strategies. Jones has an extensive background in portfolio analysis and analytics as well as risk analysis. J.W. strives to reach traders that are missing opportunities trading options and commits to writing content which is not only educational, but entertaining as well. Regular readers will develop the knowledge and skills to trade options competently over time. Jones focuses on writing spreads in situations where risk is clearly defined and high potential returns can be realized.
This article is intended solely for information purposes. The opinions are those of the author only. Please conduct further research and consult your financial advisor before making any investment/trading decision. No responsibility can be accepted for losses that may result as a consequence of trading on the basis of this analysis.
© 2005-2022 http://www.MarketOracle.co.uk - The Market Oracle is a FREE Daily Financial Markets Analysis & Forecasting online publication.