


Gold in Blow-off Stage or a Lot More to Come?
Commodities / Gold and Silver 2011 Aug 21, 2011 - 11:24 AM GMTBy: Merv_Burak

 Boy, you leave for a few days and all hell breaks loose. Gold is up some $200 since I last looked. Is this a “blow-off” stage or is there still a lot more to come?
GOLD
LONG TERM
Long term gold bugs should have been into gold long time ago. At the present time if one wants to buy gold this is a very risky time for that. The chart sure does look like a blow-off stage where gold goes sharply through the roof and that is the end of the bull for some time. The latest move is the sharpest rise (with the highest long term momentum reading) since May of 2006 after which gold took a year long lateral breather followed by a roller coaster ride into late 2008 before it finally started a new bull move. The “investor” who panicked and jumped in to get in on the gold move in May of 2006 found himself holding a non-performer for over two years. This type of “investor” probably got out in frustration before the next move, missing the next bull.
Trend: The gold price remains comfortably above its positive sloping long term moving average line. It is also far above its up trending long term channel (shown here in Commentary for week ending 29 July 2011) support line. It has also broken above its upper resistance line suggesting further a blow-off stage. Only time will tell.
Strength: The long term momentum indicator is deep inside its positive zone and above its positive sloping trigger line. As mentioned above, this momentum indicator is now at its highest level since May of 2006. Strong strength, maybe too strong.
Volume: The volume indicator is moving higher into new high territory, far above its May of 2006 level. It is comfortably above its positive trigger line.
At the Friday close the long term rating can only be BULLISH.
INTERMEDIATE TERM
Over the past couple of months the intermediate term has taken a sharp upward direction. As yet there is no clear indication of a turn around.
Trend: Gold remains well above its positive sloping intermediate term moving average line. It is also well above an intermediate term up trend line from its first of July low.
Strength: The intermediate term momentum indicator remains in its positive zone above its positive trigger line. It has entered its overbought zone so one can expect some hesitation in the price move but as yet no turn around is being noted.
Volume: As noted in the long term section, the volume indicator has entered new all time highs and remains above its intermediate term positive trigger line.
As of the Friday close the intermediate term rating remains BULLISH. This is confirmed by the short term moving average line remaining above the intermediate term line.
SHORT TERM
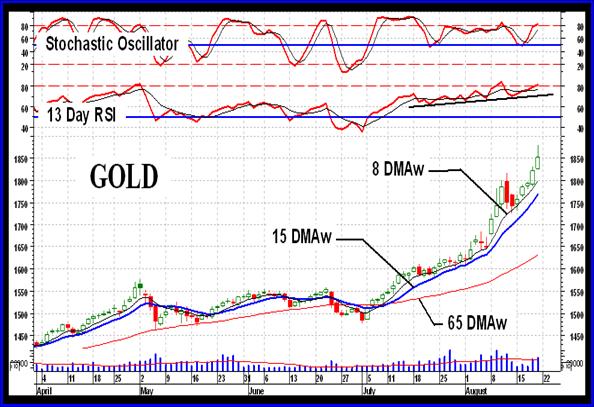
Looking at the short term chart one can get either overly enthusiastic or very cautious at this point. Is the action a sign of things yet to come or is it a blow-off ready to disintegrate? Not being a fortune teller I’ll stick to what IS happening and leave the fortune telling to others.
Trend: There is no denying, the trend is most definitely to the up side, at least as far as the Friday close is concerned. Gold remains above its short term moving average line and the line is sloping upwards.
Strength: The short term momentum indicator is showing continued improvement in strength to the point that it is now entering its overbought zone. It has been there before, just a week ago. This time around, although the price is into new highs the momentum is now holding back and not yet into new highs. This may be a negative divergence but it’s too early to say. You need a reversal to know if in fact we had a divergence. I guess one might see the latest action as strength starting to diminish as the price continues to rise.
Volume: Remember my caution about volume action. One likes to see the volume increase as the up trend gets going BUT not increase after it has been going for some length of time. The lather suggests the masses getting in late and is too often near a top. This seems to be what we might have had here last week. This week the price continued higher but the volume dropped off, never an encouraging sign.
Despite all the cautionary signs, at the Friday close the rating remains BULLISH. This is confirmed by the very short term moving average line remaining above the short term line.
As for the immediate direction of least resistance, that should be to the up side but I just think things are too positive and a surprise is somewhere ahead, maybe immediately ahead. I’ll go with the lateral direction as a compromise.
SILVER
Although the silver point and figure chart shows a bullish upside break a month back the price has really gone nowhere since. It has been in a basic lateral trend since the May plunge. The $43 level would be the next upside break and possibly more potent. Although silver closed on Friday at a new recovery high the intermediate term (my preferred time period) momentum indicator is still not at its new recovery highs. The price move seems to be ahead of the price strength. Something’s gotta give.
LONG TERM
Trend: Silver remains above its positive sloping long term moving average line.
Strength: The long term momentum indicator remains in its positive zone and once more above a positive trigger line. As noted above with the intermediate term momentum indicator, the long term momentum indicator is lagging the price action and remains below its previous recovery highs.
Volume: The volume indicator continues to move in a long term lateral path but has moved above its positive sloping trigger line. As with the momentum indicator the volume indicator is lagging the price action.
Putting it all together, at the Friday close the long term rating remains BULLISH. However, there seem to be too many warnings of weakness in the move so one just might wait for better confirmation of the long term trend before jumping in with long term commitments.
INTERMEDIATE TERM
Trend: Silver continues to move above its positive sloping intermediate term moving average line. The price has broken into new intermediate term highs but it remains to be seen if this is a true break or a false one.
Strength: The intermediate term momentum indicator is moving higher within its positive zone and above its positive trigger line. It is, however, lagging behind the price action indicating a loss of strength behind the move versus earlier moves. As always, this is only a warning and not a prediction.
Volume: As with the long term, the intermediate term volume indicator is moving slightly higher and is above its positive trigger line. However, it still remains below its actions from the past few months.
Still, despite the warnings and weakness shown by some of the indicators the intermediate term rating, as of the Friday close, remains BULLISH. This is confirmed by the short term moving average line remaining above the intermediate term line.
SHORT TERM
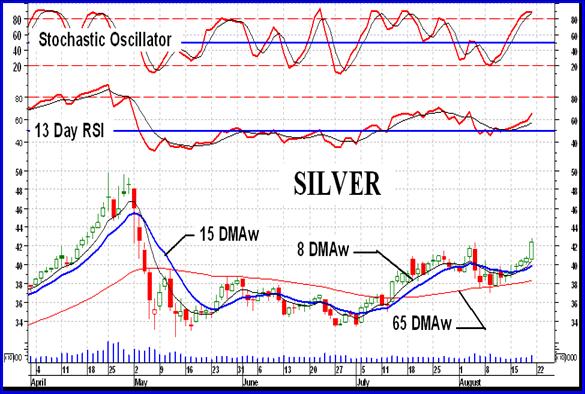
It’s always instructive to compare one commodity against another. It’s more instructive just to compare the chart performances of the two. Here we see the under performance of silver, since the plunge, versus the performance of gold for a similar time period. Silver has closed at a new recovery high but this is not yet confirmed by either the momentum or the volume action.
Trend: Silver closed above its positive sloping short term moving average line. The trend seems to be to the up side but it could use a little more strength behind the move to provide more confidence in its longevity.
Strength: The short term momentum is back in its positive zone and above its positive sloping trigger line.
Volume: The daily volume action remains low and not as yet an encouragement for further upside price action. Maybe the volume will pick-up but we will need to see it.
Despite the warnings, at the Friday close the short term rating remains BULLISH with the very short term moving average line confirming by remaining above the short term line.
PRECIOUS METAL STOCKS
Despite the very strong upside moves in gold and silver during the past week and a reasonable upside move by the various North American Gold Indices the Merv’s Indices held back on their moves. This suggests that as far as the stocks were concerned “investors” were in the game on the “quality” buy side but speculators were still holding back as far as the majority of stocks were concerned. THIS is not the actions of a bullish stock environment, at least not yet at this time. One should be very cautious when the speculators are holding back or not speculating. THEIR buying actions are suggestive of a bullish environment while the actions of “quality” “investors” are the actions of fear and worry (not long term sentiments). At the present time we have worry suggested from both camps.
As the gold chart earlier showed, gold is screaming “new all time highs”, “new all time highs”, BUT none of the major North American Indices, or any of the Merv’s Indices, are making new all time highs. As I have often suggested, the stocks are often the leading indicator of what the commodity is expected to do in the not too distant future.
Looking at the various Merv’s Indices they all have been going through a year long wide lateral trend with a few of them showing very clear potential head and shoulder patterns. Only the Penny Arcade Index is not following this scenario. It, however, is in a well definite down trend although it just might be ready to move sideways for a while.
Merv’s Precious Metals Indices Table
Well, that’s it for this week. Comments are always welcome and should be addressed to mervburak@gmail.com.
By Merv Burak, CMT
Hudson Aero/Systems Inc.
Technical Information Group
for Merv's Precious Metals Central
For DAILY Uranium stock commentary and WEEKLY Uranium market update check out my new Technically Uranium with Merv blog at http://techuranium.blogspot.com .
During the day Merv practices his engineering profession as a Consulting Aerospace Engineer. Once the sun goes down and night descends upon the earth Merv dons his other hat as a Chartered Market Technician ( CMT ) and tries to decipher what's going on in the securities markets. As an underground surveyor in the gold mines of Canada 's Northwest Territories in his youth, Merv has a soft spot for the gold industry and has developed several Gold Indices reflecting different aspects of the industry. As a basically lazy individual Merv's driving focus is to KEEP IT SIMPLE .
To find out more about Merv's various Gold Indices and component stocks, please visit http://preciousmetalscentral.com . There you will find samples of the Indices and their component stocks plus other publications of interest to gold investors.
Before you invest, Always check your market timing with a Qualified Professional Market Technician
Merv Burak Archive |
© 2005-2022 http://www.MarketOracle.co.uk - The Market Oracle is a FREE Daily Financial Markets Analysis & Forecasting online publication.