


Stock Market Intermediate Signals Still Pointing Down!
Stock-Markets / Stocks Bear Market Aug 27, 2011 - 02:12 AM GMTBy: Mike_Paulenoff

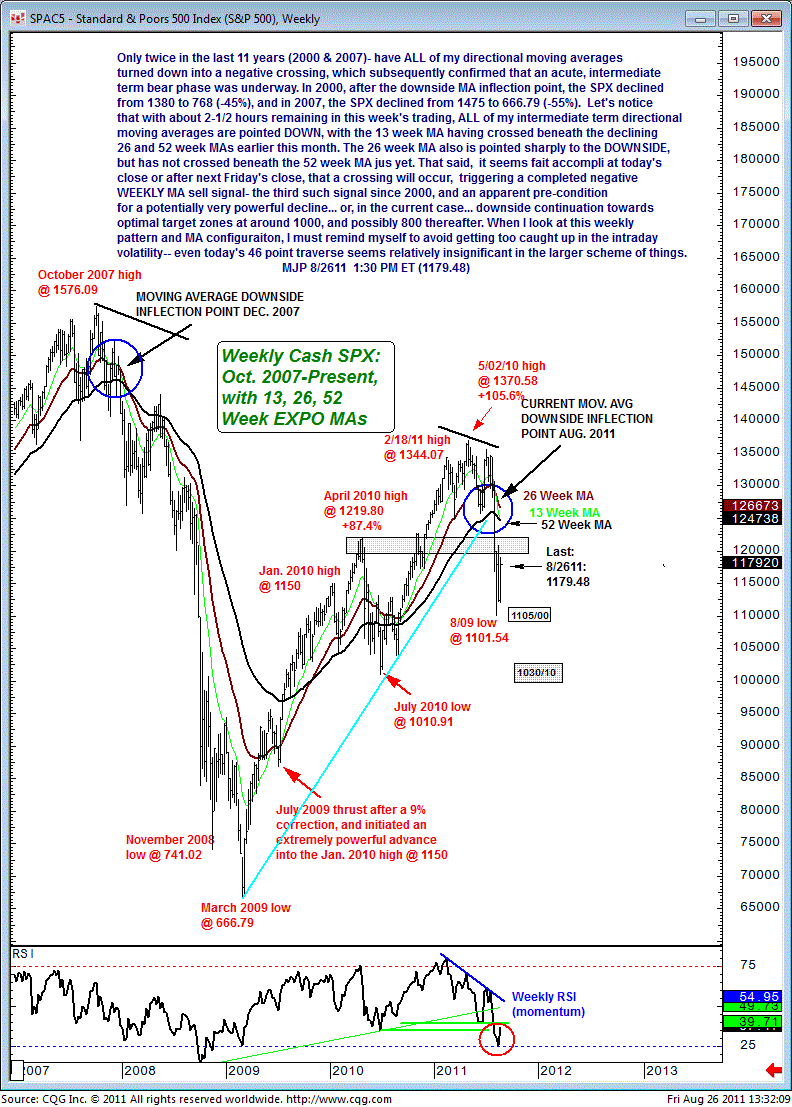
 To put today's upmove in a larger perspective -- certainly larger than my 1-minute or 4-hours chart analytics, let's have a look at my updated weekly pattern and moving average analytics in the cash SPX.
Only twice in the last 11 years (2000 & 2007) have ALL of my directional moving averages turned down into a negative crossing, which subsequently confirmed that an acute, intermediate-term bear phase was underway. In 2000, after the downside MA inflection point, the SPX declined from 1380 to 768 (-45%), and in 2007 the SPX declined from 1475 to 666.79 (-55%).
Let's notice that with about 2-1/2 hours remaining in this week's trading, all of my intermediate term directional moving averages are pointed down, with the 13-week MA having crossed beneath the declining 26- and 52-week MAs earlier this month. The 26-week MA also is pointed sharply to the downside, but has not crossed beneath the 52 -week MA just yet.
That said, it seems a fait accompli at today's close or after next Friday's close that a crossing will occur, triggering a completed negative weekly MA sell signal -- the third such signal since 2000 -- and an apparent pre-condition for a potentially very powerful decline. Or, in the current case, it will mean downside continuation towards the optimal target zones at around 1000, and possibly 800 thereafter.
When I look at this weekly pattern and MA configuration, I must remind myself to avoid getting too caught up in the intraday volatility -- even today's 46 point traverse seems relatively insignificant in the larger scheme of things.
Sign up for a free 15-day trial to Mike's ETF & Stock Trading Diary today.
By Mike Paulenoff
Mike Paulenoff is author of MPTrader.com (www.mptrader.com), a real-time diary of his technical analysis and trading alerts on ETFs covering metals, energy, equity indices, currencies, Treasuries, and specific industries and international regions.
© 2002-2011 MPTrader.com, an AdviceTrade publication. All rights reserved. Any publication, distribution, retransmission or reproduction of information or data contained on this Web site without written consent from MPTrader is prohibited. See our disclaimer.
Mike Paulenoff Archive |
© 2005-2022 http://www.MarketOracle.co.uk - The Market Oracle is a FREE Daily Financial Markets Analysis & Forecasting online publication.