


Stock Market New Uptrend Underway After Bernanke's Jackson Hole Speech?
Stock-Markets / Stock Markets 2011 Aug 27, 2011 - 01:19 PM GMTBy: Tony_Caldaro

 The equity market reversed last week’s loses with equally impressive gains this week. After hitting a low on monday (SPX 1121) the market surged to 1191 early thursday, and then got struck by a selloff in Germany and concern about FED chairman Bernanke’s Jackson Hole speech. Then after hitting SPX 1136 the market rallied into the friday close. Economic reports were sparse and generally negative. Improving, were durable goods orders, FHFA housing prices and consumer sentiment. On the downtick, were new homes sales, Q2 GDP, the monetary base, the WLEI and weekly jobless claims rose. For the week the SPX/DOW gained 4.5%, and the NDX/NAZ gained 6.0%. Asian markets gained 1.1%, European markets gained 1.9%, the Commodity equity group gained 1.9%, and the DJ World index rose 2.5%. Next week we have an abundance of economic reports: ISM, the Chicago PMI, PCE prices, the Case-Shiller index, and the Payrolls report on friday.
LONG TERM: bear market highly probable
We continue to count the market activity from the May 2011 SPX 1371 high as a bear market. Thus far we have completed three waves down: Major A SPX 1258 Jun11, Major B SPX 1356 Jly11, and Major C (Primary A) possibly ended at SPX 1121 Aug11. Notice the three waves have all taken just one month to unfold: May high – June low – July high - August low. This is typical early bear market action. If you recall the bear market from the October 2007 high also started in a similar fashion: Oct high – Nov low – Dec high – Jan low – Feb high – Mar low.
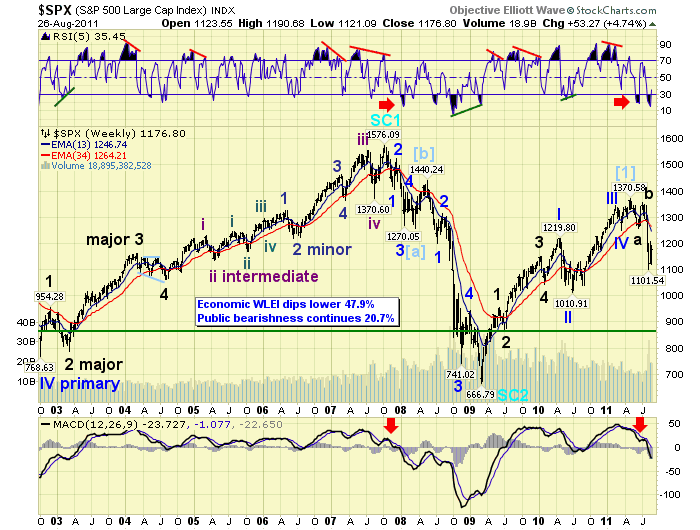
Technical evidence for a bear market can be observed in the weekly chart above. Notice during the two previous bull markets RSI got extremely overbought and rarely oversold, while MACD stayed above neutral. Notice how the technicals reversed during the 2007-2009 bear market and now. RSI extremely oversold and barely overbought, while MACD enters and remains in negative territory.
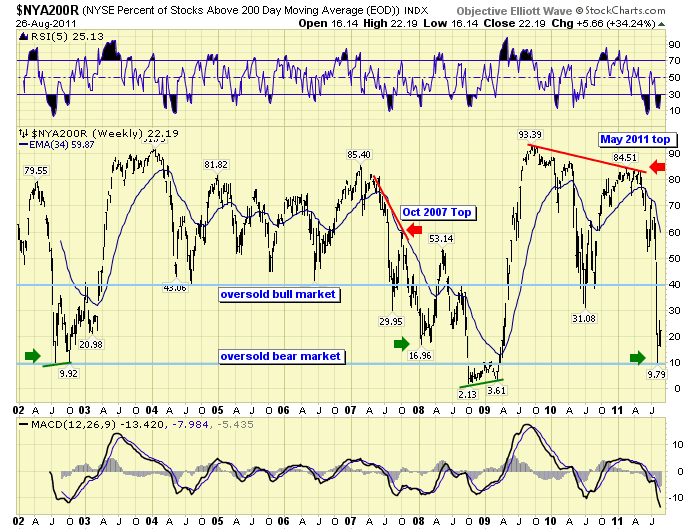
This bear market, however, looks to be different than the last one. During the 2007-2009 bear market it took five months and five waves down before the market even approached an oversold condition (16.96) around March 2008. Then after the market rallied back to neutral (53.14) in May 2008 the market tanked to a 2.13 reading and then a 3.61 reading at the low. Notice how this bear market has already hit an oversold condition (9.79) after only three months. This suggests the three waves down from the May 2011 high should be an important low. Therefore, the wave structure of this bear market should be different than the wave structure of the last. We noted this oversold condition and potential wave structure difference in last weekend’s report.
MEDIUM TERM: downtrend may have bottomed
The wave structure for this July downtrend clearly displays four waves down. Then either a failed fifth wave at SPX 1121 or an ongoing, trading range, fourth wave. We posted the potential for these two counts in the tuesday update, after the market failed to make a lower low on monday and rallied tuesday. When we review the price action around the 1102 low on August 9th. We find the market had made a SPX 1119 downtrend low on monday the 8th. Then the market bounced around on tuesday hitting SPX 1117 and then 1102 right after the FOMC statement, before surging to end the day at 1173. This clearly looks like a third and fourth wave underway. Then after the market ended the 4th wave at SPX 1208 on the 17th, the market dropped to 1122 on the 19th and then 1121 on the 22nd. After that the market started the current rally.
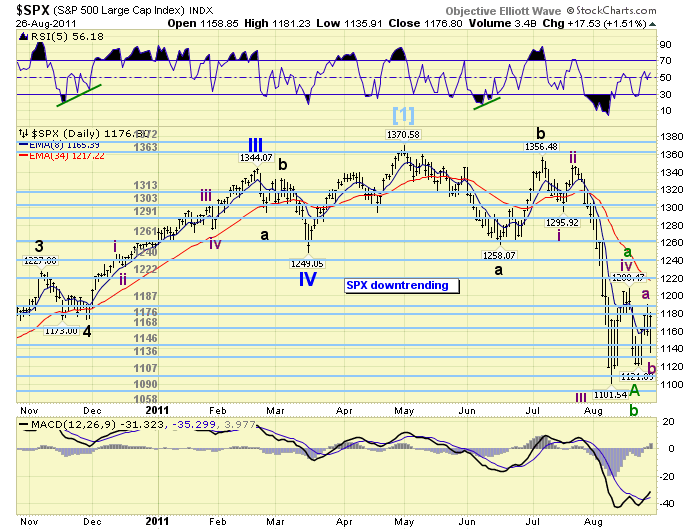
This price action suggests a fifth wave failure, or truncated fifth wave, during a bear market oversold condition. This week the market generated a WROC buy signal: 90% success rate. These signals are quite rare, only 20 signals in the past four years, and often arrive before OEW confirms an uptrend. As a result of this signal we are increasing the probability of the fifth wave failure count, posted on the above chart, with a tentative green Primary wave A. The ongoing 4th wave scenario remains in green and is now an alternate count.
To summarize everything posted thus far we offer the following preferred count. Since the market reached an oversold condition for a bear market, this suggests the first significant decline is over. Therefore, we are not expecting five waves down, i.e. 2007-2008, for the first significant wave of this bear market. Only three waves down. This is why we have labeled this bear market with Major A, Major B and Primary A. Next we should get a choppy two month rally into October, taking the form of a double zigzag but one uptrend, and retracing at least 50% of the total decline thus far. This would suggest an uptrend to at least the OEW 1240 pivot, and possibly the 1261 or 1290 pivots. Then using the WROC buy signal as a guideline, the market suggests the uptrend should now be underway.
SHORT TERM
Support for the SPX is at 1176 and then 1168, with resistance at 1187 and then 1222. Short term momentum ended the week just below overbought. We updated the SPX hourly/daily charts to reflect the preferred count: Major wave A Jun low at SPX 1258, Major wave B July high at SPX 1356, and Major wave C (Primary wave A ‘green’) August low at SPX 1102/1121. Now we are expecting a two month abA-B-abC uptrend hitting, at minimum the OEW 1240 pivot and then the 1261 or 1290 pivots. We have labeled the first two waves as Intermediate waves A SPX 1191 and B SPX 1135 of Major wave A. Remember, all the counter rally intermediate and major waves should occur during one uptrend. Ideally the expected uptrend should reach the OEW 1261 pivot to overlap the first wave down: Major A at SPX 1258.
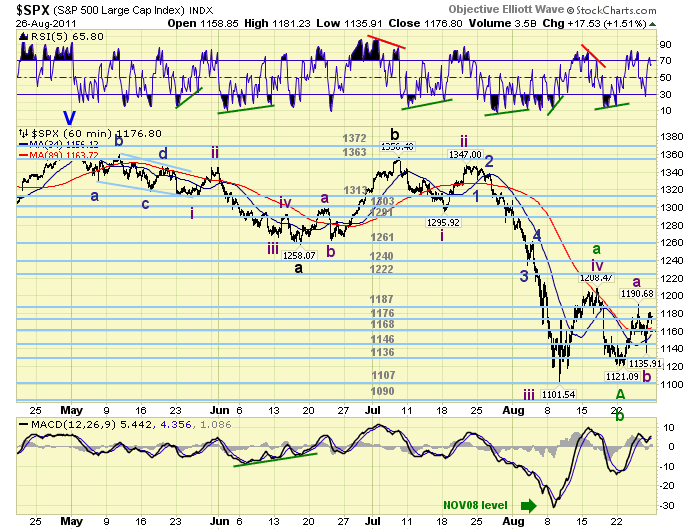
Short term support is clearly at the OEW pivots: 1176, 1168 and 1146. Short term overhead resistance is at the 1187 pivot, the low 1200′s and the 1222 pivot. The short term OEW charts remain positive as long as the SPX holds the 1168 pivot range.
Alternative counts would suggest an ongoing abc Intermediate wave iv to top around 1208 or the 1222 pivot range, then a drop to lower lows. Another alternative is an Intermediate wave iv triangle, which would now be complete, then a drop to lower lows. Probabilities, however, suggest a new uptrend is underway. Best to your trading!
FOREIGN MARKETS
The Asian markets were mostly higher on the week for a net gain of 1.1%. India was the only loser, and all remain in downtrends.
The European markets were all higher on the week for a net gain of 1.9%. All remain in downtrends here too.
The Commodity equity markets were all higher on the week for a net gain of 1.9%. Again all three are in downtrends.
The DJ World index is downtrending but gained 2.5% on the week.
COMMODITIES
Bonds are still uptrending, -0.3% on the week, but we are observing negative divergences on price and yield.
Crude, gained 3.2% on the week, put in an important low in early August but the rally since then has been quite choppy.
Gold, -1.3% on the week, had quite a roller coaster ride after the overnight $1918 all time high tuesday. After dropping over $200 in just three days it turned right around and nearly rallied $125 into friday’s close. We counted five waves up from the early July low at $1478 to the recent high, and consider the recent price action as part of a correction. This $440 uptrend was the biggest uptrend (dollar rise) of the entire 10 year bull market.
The USD, -0.3% on the week, continues to go sideways and remains in a downtrend.
NEXT WEEK
A busy economic calendar ahead. Monday, Personal income/spending at 8:30 along with PCE prices, and Pending home sales at 10:00. Tuesday, Case-Shiller and Consumer confidence. Wednesday, the ADP index, Chicago PMI and Factory orders. Thursday, weekly Jobless claims, Productivity, ISM manufacturing, Construction spending and monthly Auto sales. Then on friday, the monthly Payrolls report and the Unemployment rate. As for the FED. The FOMC minutes on tuesday, and a speech from FED governor Duke in Wash., DC on wednesday. This all leads into a 3-day holiday weekend next week. Best to you and yours this weekend and week!
CHARTS: http://stockcharts.com/...
http://caldaroew.spaces.live.com
After about 40 years of investing in the markets one learns that the markets are constantly changing, not only in price, but in what drives the markets. In the 1960s, the Nifty Fifty were the leaders of the stock market. In the 1970s, stock selection using Technical Analysis was important, as the market stayed with a trading range for the entire decade. In the 1980s, the market finally broke out of it doldrums, as the DOW broke through 1100 in 1982, and launched the greatest bull market on record.
Sharing is an important aspect of a life. Over 100 people have joined our group, from all walks of life, covering twenty three countries across the globe. It's been the most fun I have ever had in the market. Sharing uncommon knowledge, with investors. In hope of aiding them in finding their financial independence.
Copyright © 2011 Tony Caldaro - All Rights Reserved Disclaimer: The above is a matter of opinion provided for general information purposes only and is not intended as investment advice. Information and analysis above are derived from sources and utilising methods believed to be reliable, but we cannot accept responsibility for any losses you may incur as a result of this analysis. Individuals should consult with their personal financial advisors.
© 2005-2022 http://www.MarketOracle.co.uk - The Market Oracle is a FREE Daily Financial Markets Analysis & Forecasting online publication.