


Get Ready for Gold and Silver Christmas Rally
Commodities / Gold and Silver 2011 Sep 19, 2011 - 03:36 PM GMTBy: Peter_Degraaf

 During 18 of the last 22 years, gold has rallied between US Labor Day and Christmas. Will the pattern this year follow the historical pattern? We will analyze the fundamentals, look at some charts and try to draw a conclusion. The charts in this report are courtesy Stockcharts.com unless indicated.
- First a quote by President Andrew Jackson: "Gentlemen, I have had men watching you for a long time, and I am convinced that you have used the funds of the bank to speculate in breadstuffs of the country. When you won, you divided the profits among yourselves, and when you lost, you charged it to the bank. You tell me that if I take the deposits from the bank and annul its charter, I shall ruin ten thousand families. That may be true, but that is your sin! Should I let you go on, you will ruin fifty thousand families, and that would be my sin! You are a den of vipers and thieves. I intend to rout you out and by the Eternal God, I will rout you out." (Spoken to a delegation of bankers requesting the extension of the 1832 Bank Renewal Act).
Several news items during the past ten days were very bullish for gold. The first was an announcement by the Swiss National Bank that they were planning to buy Euros with Swiss Francs. This action effectively removes the Swiss Franc as a convenient alternative to gold, and it moves the SNB into the camp of the money printers.
The second item concerns an announcement by five major central banks (FED, ECB, SNB, BOJ and BOE), to provide dollar liquidity for a number of European banks that suffer from exposure to Greek banks. This dollar liquidity operation will last until the end of the year and will enable dollar funding for European banks, which were struggling. It shows that the Federal Reserve, the ECB and also British, Swiss and Japanese banks have the will and the ability to cooperate at sensitive times, whenever they feel the system needs a 'nudge'.
Another factor that is very bullish for gold is the current 'negative real interest rate' environment. Regardless of whether we believe the 'official' CPI numbers, or the more realistic numbers provided by Shadowstats.com, anyone with money in the bank, or holding short-term Treasury notes, is losing money to price inflation. 10-year Treasuries are paying a miserly two percent. With inflation at 4.8%, these 'so-called investments' are losing 2.8% of their value over 12 months According to J. M. Keynes, and many other economists, whenever 'real interest rates' turn negative, gold will rise. Keynes called this "Gibson's Paradox", and stated that there are no exceptions.
Finally, the most bullish facilitator of rising gold and silver prices is the supply of money (see chart below).
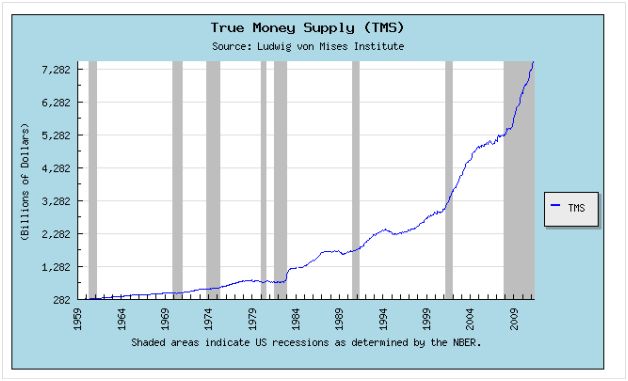
This chart courtesy Mises.org shows the True Money Supply continues to rise exponentially. A rising money supply is bullish for gold and silver, as it increases the amount of money available for the purchase of precious metals. As long as the Central Banks keep the banking system supplied with money, the banking system will survive. This principle is far more important to the Central Banks than the integrity of the currency. Historically, 'monetary inflation' always causes 'price inflation'. The U.S. consumer-price index (CPI) increased 0.4% in August. That's an annual inflation rate of 4.8%!
The TMS chart also shows that, according to the people as Mises.org, the recession is ongoing (grey area). During recessions, there is less money coming in to government, while expenses such as unemployment benefits, food stamps, welfare payments etc. increase. This in turn causes deficits to rise, and deficits provide energy for gold prices to rise.
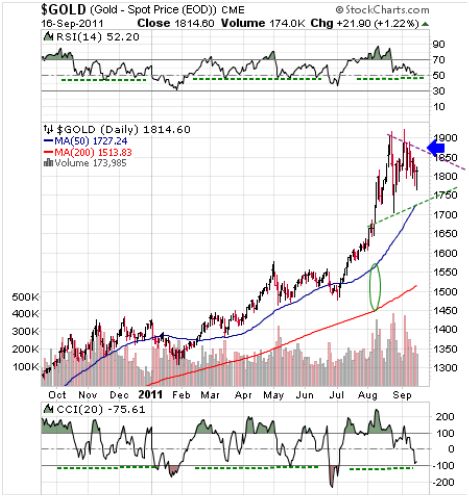
Featured is the daily gold chart. Price is carving out a bullish pennant. The supporting indicators are at levels where they have found support many times in the past. The fact that the 50DMA is in positive alignment to the 200DMA (green oval), while both are rising, is bullish. A breakout at the blue arrow will mark the beginning of the next rally.
According to the weekly Kitco survey of gold analysts, a minority 32.1% of the analysts are bullish for this week, 53.6% are bearish and 14.3% neutral. From a contrarian point of view that is bullish for gold!
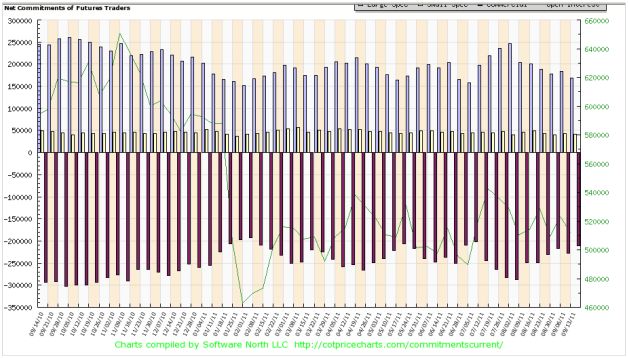
This chart courtesy Cotpricecharts.com shows commercial traders reduced their 'net short' position to 215,000 from 228,000 last week. The 'up-to-date number' will likely be even lower since the gold price dropped for two days since data for the report was compiled. At 215,000 the commercial traders are at the lowest level since July 8th. On that date gold traded at $1544 and over the next few months price rose up to $1924.
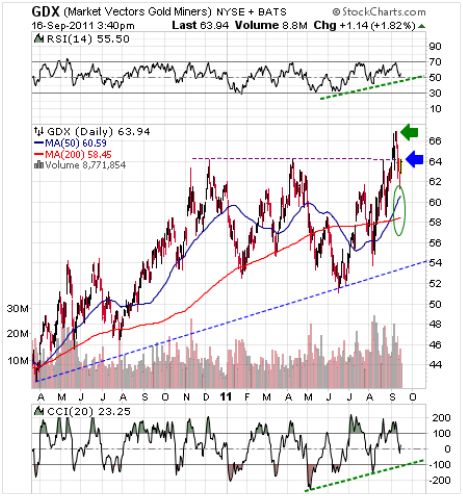
Featured is the GDX gold producers ETF. Price broke out from beneath the 64 resistance level last week (blue arrow), and since then a test of the breakout is the result as the bears press their case. Price appears ready to try again and a close above the green arrow will confirm the breakout and thereby turn the trend bullish. The SIs are positive. The fact that GDX outperformed GLD on Friday is bullish.
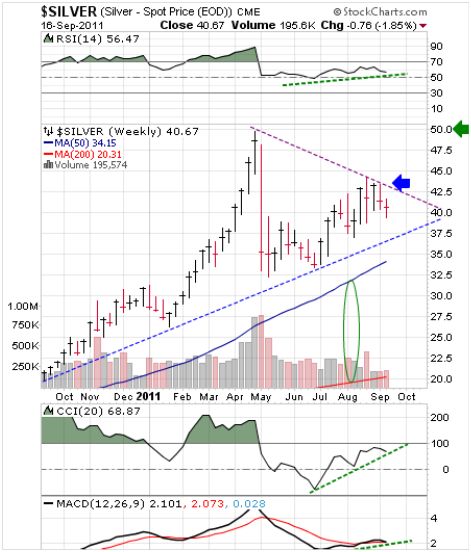
Featured is the weekly silver chart. Price is carving out a bullish pennant. The supporting indicators (green lines) are positive with a lot of room on the upside. A breakout at the blue arrow sets up a target at the green arrow. The 50WMA is in positive alignment to the 200WMA (green oval) while both are rising.
The following item courtesy Silverdoctors.com: JP Morgan Allegedly Telegraphed Silver Price Smashes Using Massive FAKE TRADES on Saxo Bank Platform
The class-action lawsuit against JP Morgan alleging silver price manipulation has exposed several shocking revelations regarding JP Morgan's alleged price suppression of silver- including the PURPOSE of major smash-downs occurring in the hours leading up to options expiration.
The suit alleges that JPM orchestrated monthly options-expiry smash downs with the express intent of blowing up the "delta" risk of holders of short, far-out-of-the money options, suddenly forcing them to cover their positions, thus handing JPM silver futures positions at prices far below market prices only minutes prior.
The suit also alleges that JPM made over 25 massive FAKE TRADES using Saxo Bank during sparse Globex evening hours prior to major silver raids for the express purpose of TELEGRAPHING AN IMPENDING SILVER SMASH TO THEIR BUDDIES!
Summary: Gold and silver are less expensive today than they were in 1980 due to the fact that there is far more paper and digital money in existence today than was the case in 1980. According to the inflation calculator provided at USinflationcalculator.com (using data supplied by the US government), the price of gold would need to rise to $2336, to match the inflation adjusted price of $850 (the 1980 peak). In the case of silver the price would need to rise to $137 to match the inflation adjusted price of $50 (the 1980 peak).
The most bullish fundamental for gold and silver is the fact that there are now 2.5 billion people who were not around in 1980. Most of these people live in China and India. By coincidence these people live in a country where the economy is growing and furthermore they love silver and gold!
Conclusion: Based on the observations presented in this report the expectation is that the annual Christmas rally in gold and silver is 'right on course'.
Happy trading!
By Peter Degraaf
Peter Degraaf is an on-line stock trader with over 50 years of investing experience. He issues a weekend report on the markets for his many subscribers. For a sample issue send him an E-mail at itiswell@cogeco.net , or visit his website at www.pdegraaf.com where you will find many long-term charts, as well as an interesting collection of Worthwhile Quotes that make for fascinating reading.
© 2011 Copyright Peter Degraaf - All Rights Reserved
DISCLAIMER: Please do your own due diligence. I am NOT responsible for your trading decisions.
Peter Degraaf Archive |
© 2005-2022 http://www.MarketOracle.co.uk - The Market Oracle is a FREE Daily Financial Markets Analysis & Forecasting online publication.
Comments
|
24 Sep 11, 13:12 |
SLV
?? SLV is below 30 now!!!!!!! |