


Bull Bear Market Phases, Dow Theory Update
Stock-Markets / Stocks Bear Market Sep 25, 2011 - 03:02 AM GMTBy: Tim_Wood

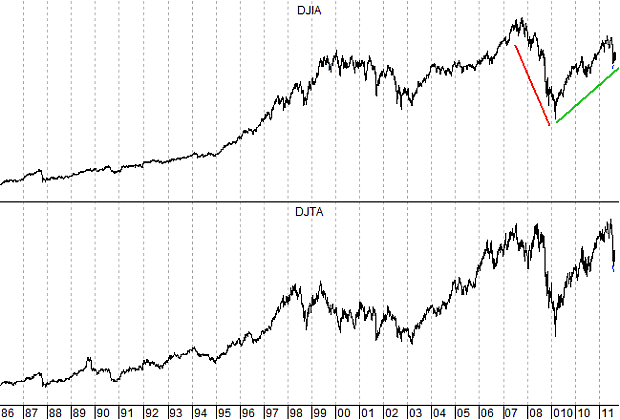
According to Dow theory, both bull and bear markets have three phases. Between each of these phases there are important counter-trend moves. Our Dow theory founding fathers explained that these counter-trend moves are misleading and tend to be taken as a continuation of the previous long-term secular trend. Based on the longer-term phasing and value aspects of Dow theory, the evidence continues to suggest that the last great bull market began at the December 1974 low and peaked in October 2007. This data also continues to suggest that the decline into the March 2009 low was merely the Phase I decline and that the rally out of the March 2009 low serves to separate Phase I from Phase II of a much longer-term secular bear market.
That's right, the rally out of the March 2009 low was not a new bull market or a continuation of the previous long-term secular bull market. Rather, it is part of a correction within a much longer-term secular bear market that began at the 2007 top. In fact, based on my longer-term bull and bear market relationship studies and other historical characteristics, the evidence suggests that once the rally out of the 2009 low has run its course, the Phase II decline should prove to be far more devastating than the Phase I decline. Therefore, from a longer-term perspective I remain very bearish.
More recently, on August 4th both the Industrials and the Transports closed below their March 2011 secondary low points. As a result, a Dow theory trend change occurred and since this is the first such trend change since the rally out of the March 2009 low began, we cannot take this development lightly. However, history shows that not all Dow theory trend changes are ominous and based on other technical data, there is a very good chance that the rally out of the March 2009 low has not yet run its course. If not, the rally separating Phase I from Phase II is not yet over. The details of these other technical studies are covered in the monthly research letters. Point being, the market is currently doing a bit of a technical high wire act in that while we do have a Dow theory trend change in place, on the other hand there is also other data that is actually still rather bullish and that suggests a higher level low is being made. This may or may not change and as a technician the key is to monitor the ongoing structural and statistical developments.
Based on the prevailing consensus, the current pessimism actually makes perfect sense. As a rule, the market does what it has to in order to confuse the most people. Ever since the decline into August began, it seems that the consensus has turned rather bearish. In fact, I personally know of no one that genuinely believes a move back above the May 2011 high is possible and maybe it isn't. But, I do find it very interesting that such bearishness is being seen in conjunction with such inconclusive technical data. As a result, it seems that the most confusing thing the market could do is to continue to rally.
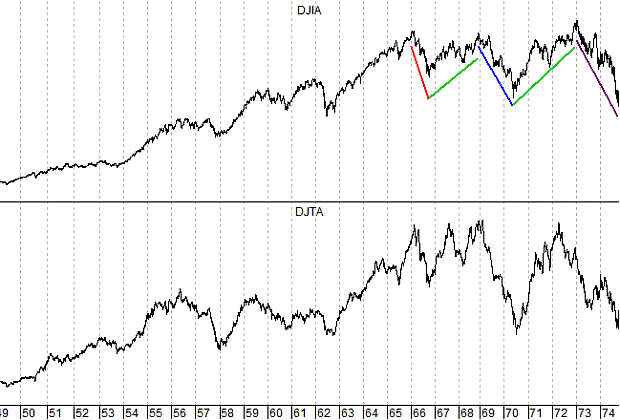
I have again included the chart of the 1966 to 1974 bear market period below for comparison. The decline into the 1966 low marked the Phase I decline of the 1966 to 1974 secular bear market. This decline appears to be synonymous with the decline into the 2009 low. The rally separating Phase I from Phase II of the 1966 to 1974 bear market carried price up some 26 months into the 1968 top. I continue to believe that the rally out of the March 2009 low is synonymous with the rally into the 1968 top. Once all of the technical factors are in place I look for the fallout to be much the same as was seen following the 1968 top. I realize that the same old message and comparison is not exciting or sexy. But, the message of the market it is what it is as the bear continues to confuse the masses. Once the technical DNA Markers are all in place, the Phase II decline should get very very nasty. In the meantime, it currently appears that a much larger trap is likely being set.
I have begun doing free market commentary that is available at www.cyclesman.info/Articles.htm The specifics on Dow theory, my statistics, model expectations, and timing are available through a subscription to Cycles News & Views and the short-term updates. I have gone back to the inception of the Dow Jones Industrial Average in 1896 and identified the common traits associated with all major market tops. Thus, I know with a high degree of probability what this bear market rally top will look like and how to identify it. These details are covered in the monthly research letters as it unfolds. I also provide important turn point analysis using the unique Cycle Turn Indicator on the stock market, the dollar, bonds, gold, silver, oil, gasoline, the XAU and more. A subscription includes access to the monthly issues of Cycles News & Views covering the Dow theory, and very detailed statistical-based analysis plus updates 3 times a week.
By Tim Wood
Cyclesman.com
© 2011 Cycles News & Views; All Rights Reserved
Tim Wood specialises in Dow Theory and Cycles Analysis - Should you be interested in analysis that provides intermediate-term turn points utilizing the Cycle Turn Indicator as well as coverage on the Dow theory, other price quantification methods and all the statistical data surrounding the 4-year cycle, then please visit www.cyclesman.com for more details. A subscription includes access to the monthly issues of Cycles News & Views covering the stock market, the dollar, bonds and gold. I also cover other areas of interest at important turn points such as gasoline, oil, silver, the XAU and recently I have even covered corn. I also provide updates 3 times a week plus additional weekend updates on the Cycle Turn Indicator on most all areas of concern. I also give specific expectations for turn points of the short, intermediate and longer-term cycles based on historical quantification.
Tim Wood Archive |
© 2005-2022 http://www.MarketOracle.co.uk - The Market Oracle is a FREE Daily Financial Markets Analysis & Forecasting online publication.