Most Popular
1. It’s a New Macro, the Gold Market Knows It, But Dead Men Walking Do Not (yet)- Gary_Tanashian
2.Stock Market Presidential Election Cycle Seasonal Trend Analysis - Nadeem_Walayat
3. Bitcoin S&P Pattern - Nadeem_Walayat
4.Nvidia Blow Off Top - Flying High like the Phoenix too Close to the Sun - Nadeem_Walayat
4.U.S. financial market’s “Weimar phase” impact to your fiat and digital assets - Raymond_Matison
5. How to Profit from the Global Warming ClImate Change Mega Death Trend - Part1 - Nadeem_Walayat
7.Bitcoin Gravy Train Trend Forecast 2024 - - Nadeem_Walayat
8.The Bond Trade and Interest Rates - Nadeem_Walayat
9.It’s Easy to Scream Stocks Bubble! - Stephen_McBride
10.Fed’s Next Intertest Rate Move might not align with popular consensus - Richard_Mills
Last 7 days
Friday Stock Market CRASH Following Israel Attack on Iranian Nuclear Facilities - 19th Apr 24
All Measures to Combat Global Warming Are Smoke and Mirrors! - 18th Apr 24
Cisco Then vs. Nvidia Now - 18th Apr 24
Is the Biden Administration Trying To Destroy the Dollar? - 18th Apr 24
S&P Stock Market Trend Forecast to Dec 2024 - 16th Apr 24
No Deposit Bonuses: Boost Your Finances - 16th Apr 24
Global Warming ClImate Change Mega Death Trend - 8th Apr 24
Gold Is Rallying Again, But Silver Could Get REALLY Interesting - 8th Apr 24
Media Elite Belittle Inflation Struggles of Ordinary Americans - 8th Apr 24
Profit from the Roaring AI 2020's Tech Stocks Economic Boom - 8th Apr 24
Stock Market Election Year Five Nights at Freddy's - 7th Apr 24
It’s a New Macro, the Gold Market Knows It, But Dead Men Walking Do Not (yet)- 7th Apr 24
AI Revolution and NVDA: Why Tough Going May Be Ahead - 7th Apr 24
Hidden cost of US homeownership just saw its biggest spike in 5 years - 7th Apr 24
What Happens To Gold Price If The Fed Doesn’t Cut Rates? - 7th Apr 24
The Fed is becoming increasingly divided on interest rates - 7th Apr 24
The Evils of Paper Money Have no End - 7th Apr 24
Stock Market Presidential Election Cycle Seasonal Trend Analysis - 3rd Apr 24
Stock Market Presidential Election Cycle Seasonal Trend - 2nd Apr 24
Dow Stock Market Annual Percent Change Analysis 2024 - 2nd Apr 24
Bitcoin S&P Pattern - 31st Mar 24
S&P Stock Market Correlating Seasonal Swings - 31st Mar 24
S&P SEASONAL ANALYSIS - 31st Mar 24
Here's a Dirty Little Secret: Federal Reserve Monetary Policy Is Still Loose - 31st Mar 24
Tandem Chairman Paul Pester on Fintech, AI, and the Future of Banking in the UK - 31st Mar 24
Stock Market Volatility (VIX) - 25th Mar 24
Stock Market Investor Sentiment - 25th Mar 24
The Federal Reserve Didn't Do Anything But It Had Plenty to Say - 25th Mar 24

Market Oracle FREE Newsletter

How to Protect your Wealth by Investing in AI Tech Stocks

Gold Stocks Bottom?

Commodities / Gold & Silver Stocks Oct 05, 2011 - 05:17 AM GMT

By: Willem_Weytjens

Commodities

Best Financial Markets Analysis ArticleEarlier today, the markets tanked on Europe concerns. Gold & Gold Stocks were not spared.

While everybody is in panic mode, it’s time to look at some interesting charts.


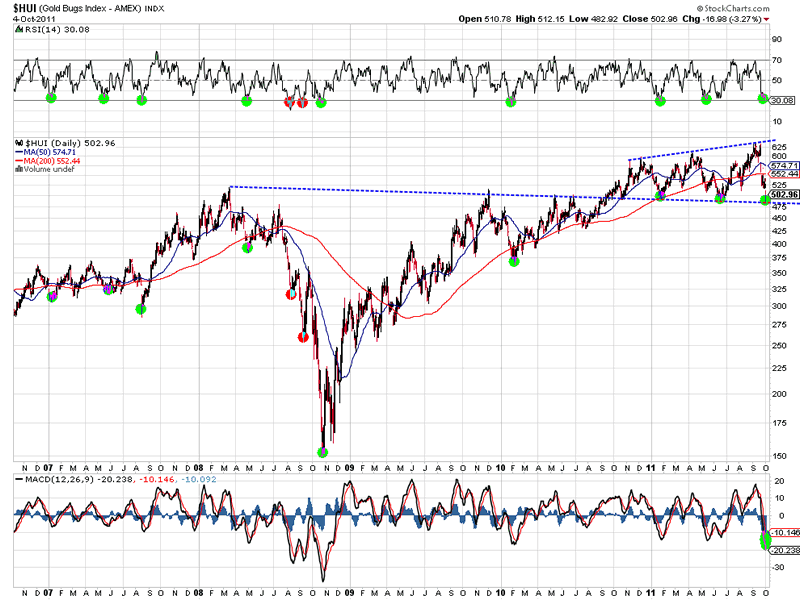
Let’s start of with the HUI index:
* The RSI reached oversold levels
* Price retested the breakout line that has been in place for the last 3.5 years
* MACD is very oversold

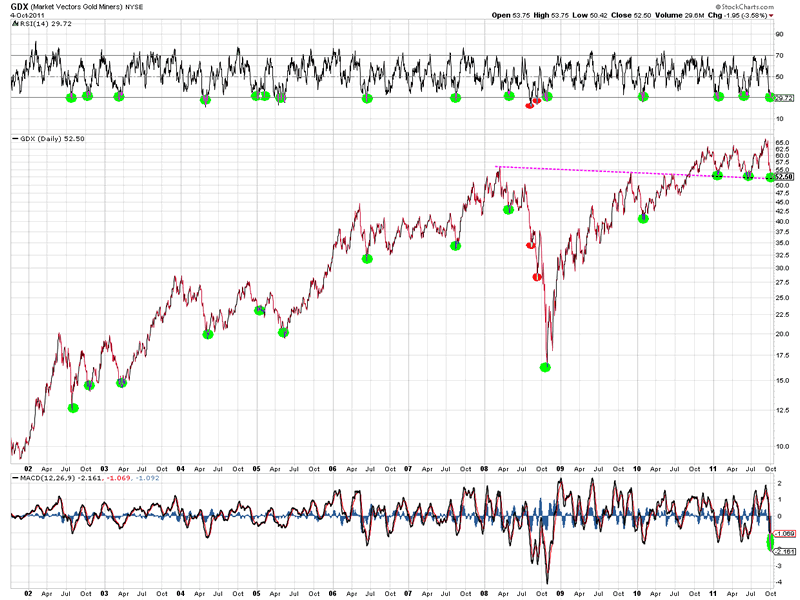
The GDX (Market Vectors Gold Miners ETF) is showing a similar picture:

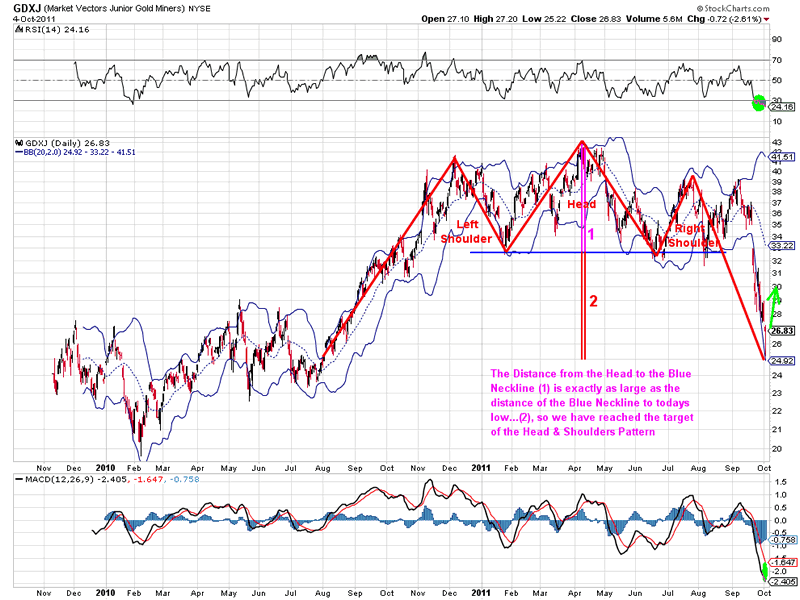
Although GDXJ (Market Vectors Junior Gold Miners ETF) does not exist long enough, it also penetrated it’s breakout zone.
* The RSI is very oversold
* Price has reached the target of the Head & Shoulders pattern on the Logarithmic chart
* MACD is very oversold

When measured in gold, CDNX, a list of Resource Exploration companies (and some Tech Companies), is as cheap as it was at the bottom in 2008:

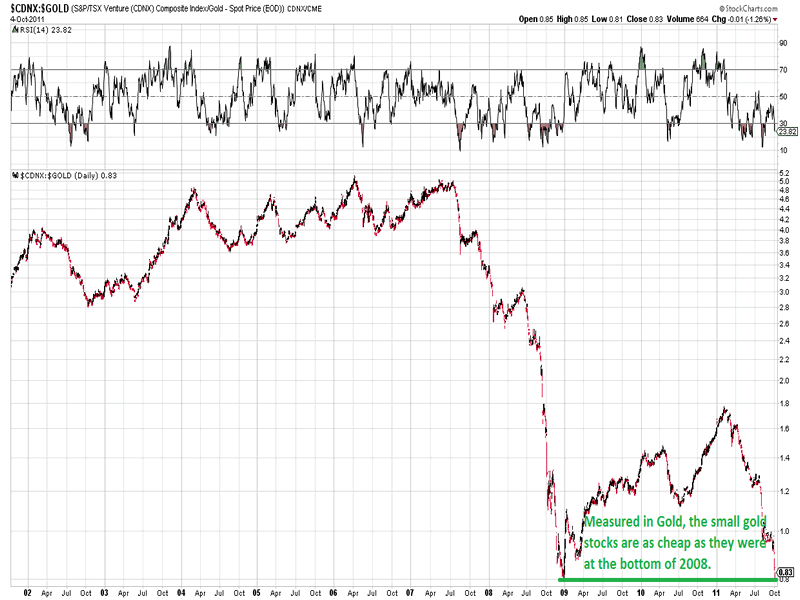
In short, I think mining stocks are at (or very close to) rock bottom levels.

Let’s have a look at Gold:

During the last 11 years of this Bull market, gold has often corrected.
As we can see in the chart below, most of the times, the correction was halted by the 35 weeks Exponential Moving Average.
So far, this 35EMA has stopped the correction as well, and the RSI is hoovering around 50 on a weekly basis, which is still a bullish sign. I have highlighted previous buying opportunities with a green circle. Will this time be any different?

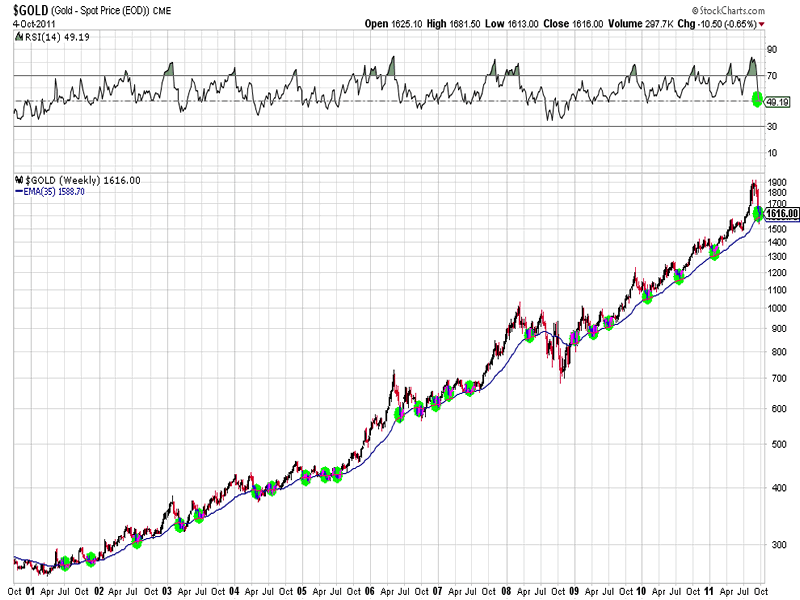
Charts above courtesy stockcharts.com

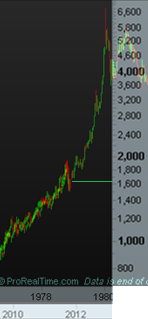
The chart below is an update of the comparison I made a couple of weeks ago between the Gold Price NOW versus the Gold Price in 1979. The pattern is also suggesting that we could be close to or at a bottom:

So sit tight and be right.

For more analyses and trading updates, please visit www.profitimes.com

Willem Weytjens

www.profitimes.com

© 2011 Copyright Willem Weytjens - All Rights Reserved

Disclaimer: The above is a matter of opinion provided for general information purposes only and is not intended as investment advice. Information and analysis above are derived from sources and utilising methods believed to be reliable, but we cannot accept responsibility for any losses you may incur as a result of this analysis. Individuals should consult with their personal financial advisors.


© 2005-2022 http://www.MarketOracle.co.uk - The Market Oracle is a FREE Daily Financial Markets Analysis & Forecasting online publication.


Post Comment

Only logged in users are allowed to post comments. Register/ Log in