


Gold, Silver And The US Dollar Analysis and Forecasts
Stock-Markets / Financial Markets 2011 Oct 10, 2011 - 06:11 AM GMTBy: Willem_Weytjens

 Last week, we wrote that gold and gold stocks could be at – or very close to – a bottom. So far so good, as the miners rallied out of oversold conditions.
Gold found support at the 35 weeks Exponential Moving Average, and RSI held above 50. That’s a good sign so far:
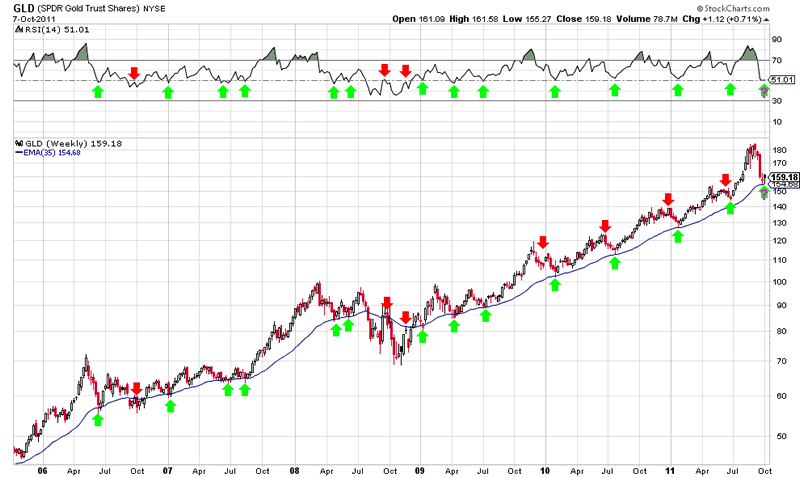
Chart courtesy stockcharts.com
Sentiment in Gold is back at very low levels, which should be bullish for Gold (although it could always drop some more):
Chart courtesy sentimentrader.com
However, when we look at the daily chart, we can see a bear flag forming right now, and the move out of oversold conditions is accompanied by decreasing volume. That’s a negative sign, and it looks like the Bear Flag could be taken out to the downside anytime now. That would cause both the RSI and MACD to turn down again.
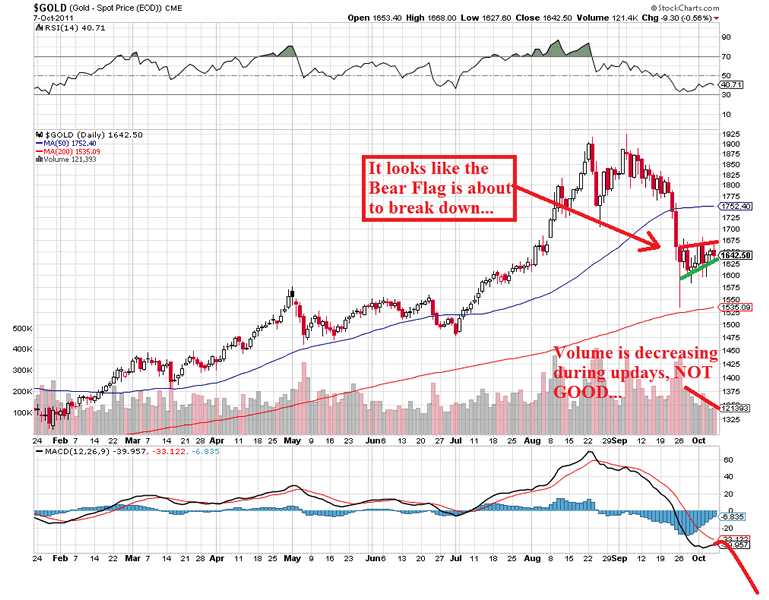
Chart courtesy stockcharts.com
Sentiment in the mining companies, as measured by the Bullish % Index is also at historically low levels, indicating that miners are severely oversold.
However, in 2008, the index fell to ZERO, so we still have the possibility that we haven’t seen the rock bottom yet. If that’s the case, last week’s bottom would only be a temporary bottom in order to work off the oversold conditions.
When we look at Fibonacci Retracement levels, we can expect 450 on the HUI index once the pink support line would break. So far, the pink support line should provide support until proven otherwise.
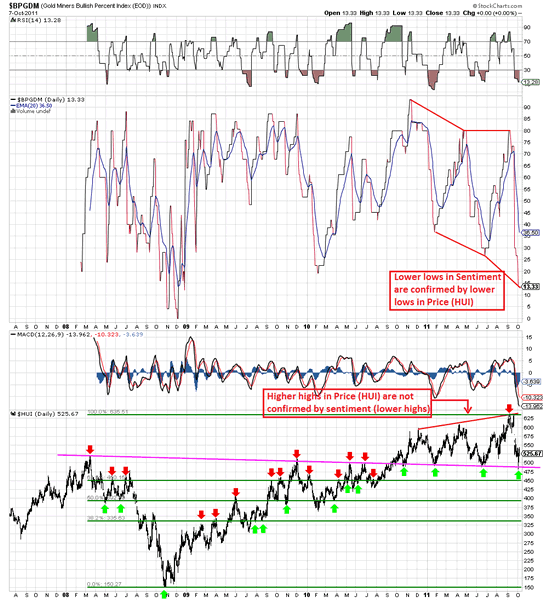
Chart courtesy stockcharts.com
That brings us to silver. Here we can see that sentiment reached extremely low levels (30.03%), which COULD bode well for silver prices going forward.
However, we have to see things in perspective. Back in 2008, sentiment remained very low for a couple of months, as silver kept falling.
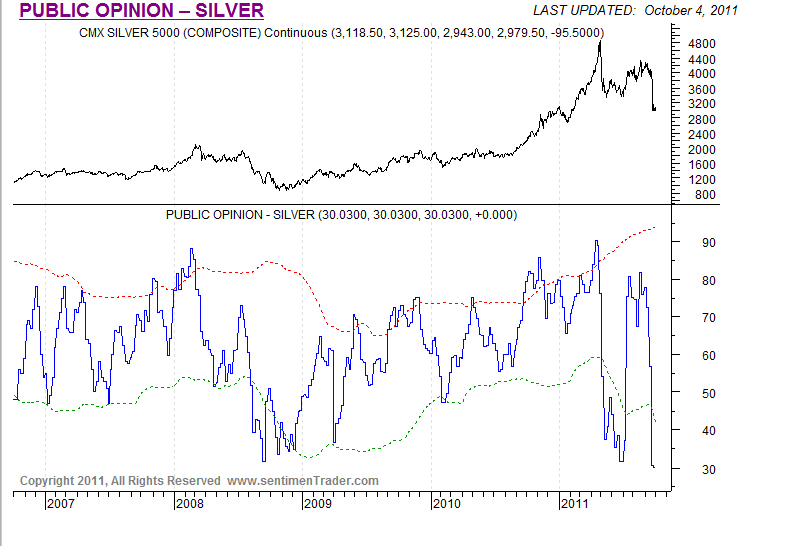
Chart courtesy sentimentrader.com
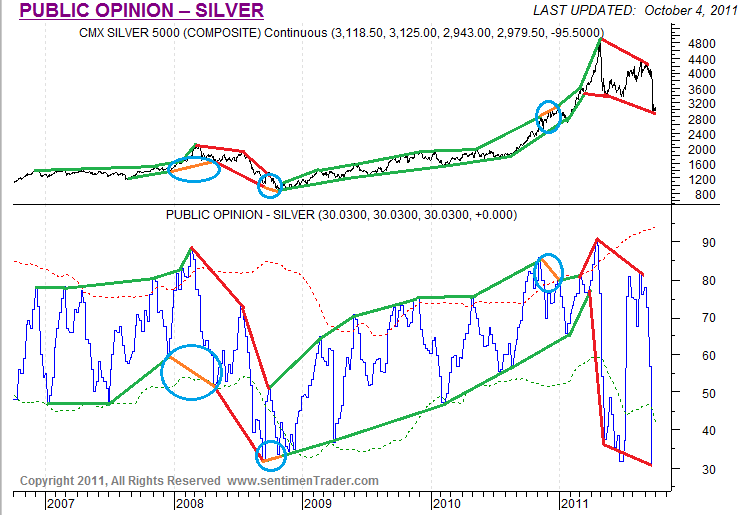
When we look at patterns of “higher highs / higher lows” and “lower highs / lower lows”, we can see that sentiment is a good indicator of what will happen to silver:
I have highlighted 3 times with a blue circle whereby the price movement was not supported by sentiment. Either we had a higher low in price and a lower low in sentiment (bearish), a lower low in price and a higher low in sentiment (bullish) or a higher high in price and a lower high in sentiment (Bearish).
Based on these patterns, we would like to see a higher low in sentiment accompanied by a lower low in price.
In the chart below, we can see that Silver recently retraced exactly 50% of the move from 3.50$ (the 1993 low) to the top of $49.82. The next Fibonacci Support level comes in at $21.18
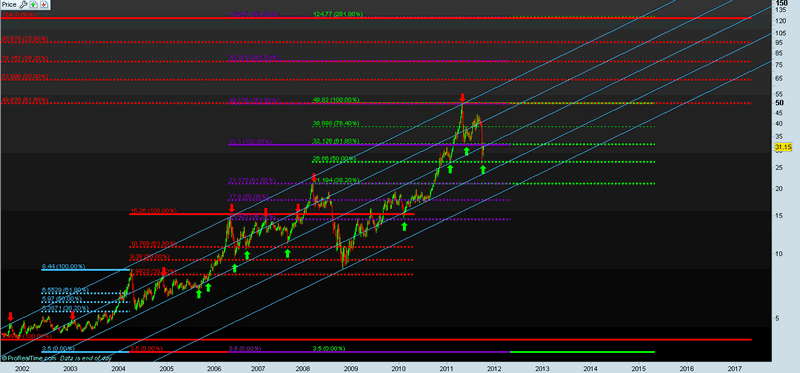
Chart: Prorealtime.com
Although the low $20′s might seem unlikely now, it’s definitely something we have to keep an eye on. Even if silver drops towards the low $20 (or even slightly below), it would not harm the long term uptrend at all, as can be seen in the following chart (the yellow pattern is based on the price action of 2008):
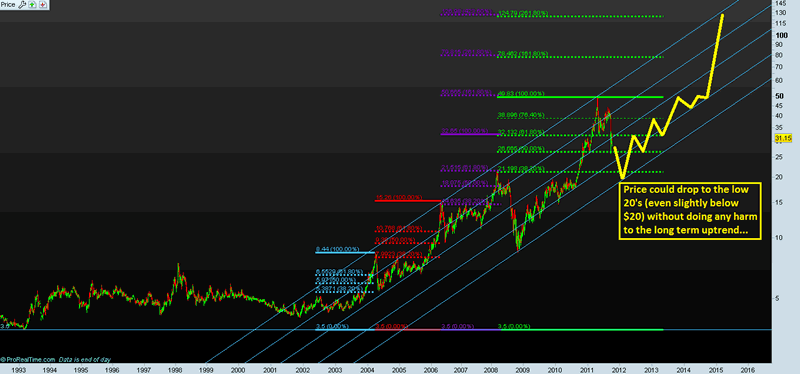
Chart: Prorealtime.com
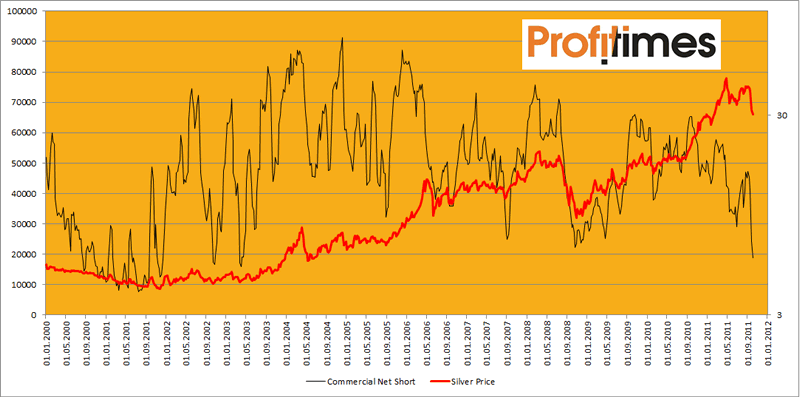
When we look at the CFTC COT reports for silver, we can see that the Commercials A.K.A. “Smart Money” have reduced their net-short positions substantially, to bull-market lows.
This seems to be bullish for silver, because if the smart money moves out of silver short positions, this could mean they are foreseeing higher prices.
Look at the chart below to see what happened during this bull market when Commercial Net short positions were this low.
It looks bullish, doesn’t it?
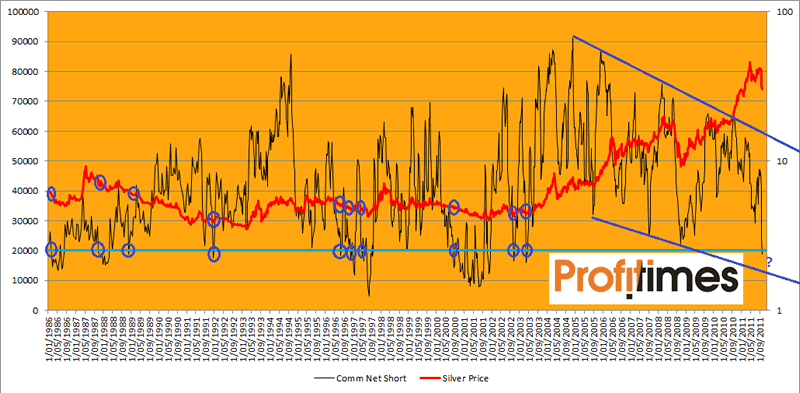
However, perspective is everything. Of course we are in a bull market (since the early 2000′s), but if we look at the COT reports going back to 1986, we can see that the Commercial Net Short positions have been this low on several occasions, and it didn’t always mean higher prices:
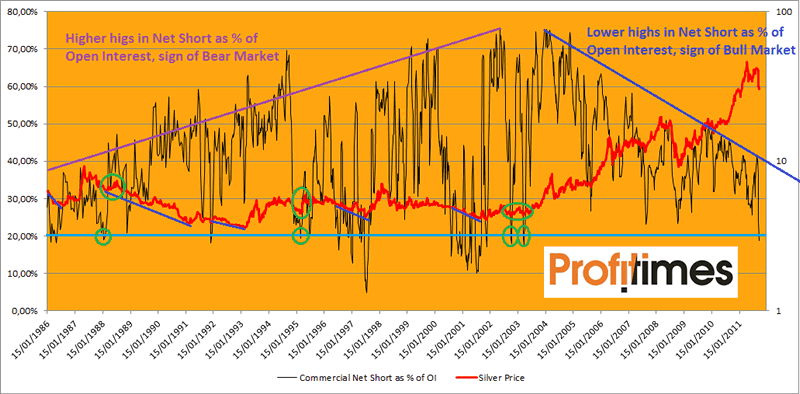
However, as the Open Interest fluctuates, it might be better to look at Commercial Net Short Positions as a Percentage of Open Interest (CNSPOI).
We can see that during the bear market, the CNSPOI was setting higher highs, while during this bull market, the CNSPOI is making lower highs.
The CNSPOI has also dropped to historically low levels, which MIGHT forecast higher prices, although this has not always been the case:
We think that everything comes down to the US Dollar. When the US Dollar falls, metals generally rise, and when the US Dollar rises, metals generally fall.
We can see that the USD Sentiment is very positive, meaning we could see a pullback. However, the fact that we had a lower high in Price early 2011 combined with a higher high in sentiment, was foretelling us that something was going on in the USD market, just like in 2008 & 2009:
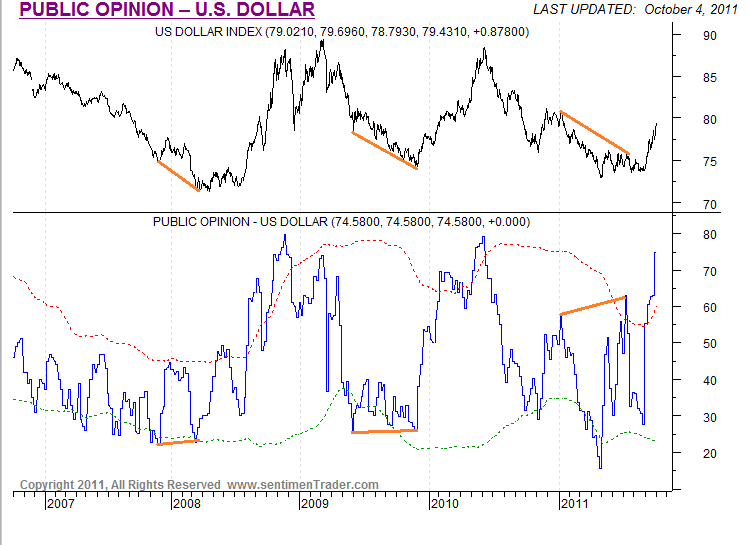
Chart courtesy sentimentrader.com
One last thing: when we compare FXI (a China ETF) with the Nasdaq Bubble, we can see that FXI is imitating the Nasdaq Index:
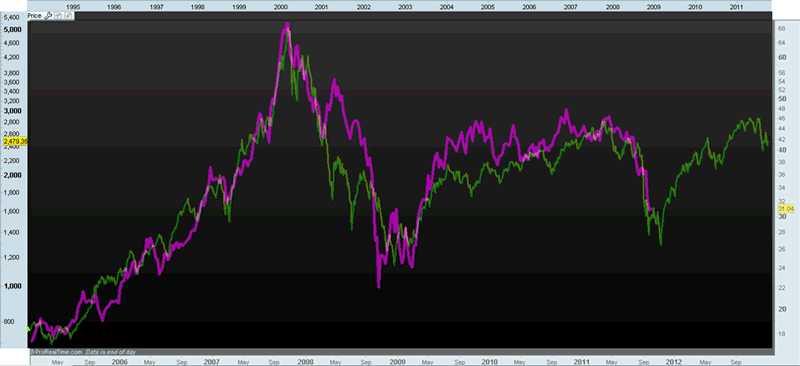
Chart: Prorealtime.com
If China drops a bit more, it might be time to buy China and everything China-related (read: COMMODITIES)
For more analyses and trading updates, please visit www.profitimes.com
Willem Weytjens
www.profitimes.com
© 2011 Copyright Willem Weytjens - All Rights Reserved
Disclaimer: The above is a matter of opinion provided for general information purposes only and is not intended as investment advice. Information and analysis above are derived from sources and utilising methods believed to be reliable, but we cannot accept responsibility for any losses you may incur as a result of this analysis. Individuals should consult with their personal financial advisors.
© 2005-2022 http://www.MarketOracle.co.uk - The Market Oracle is a FREE Daily Financial Markets Analysis & Forecasting online publication.