


Time is running out for the Stock Market
Stock-Markets / Stock Markets 2011 Oct 22, 2011 - 12:45 PM GMT

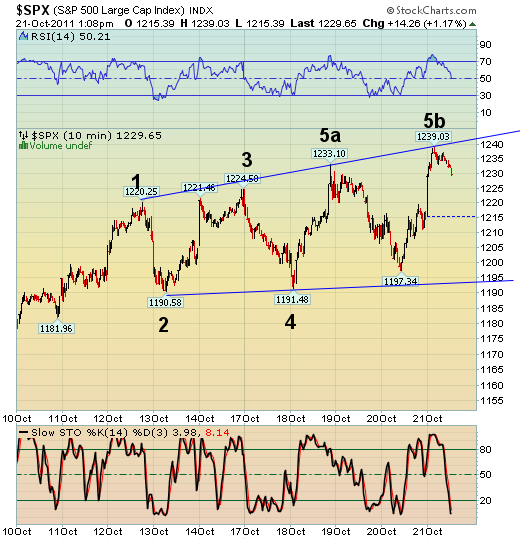
 The is an interpretation of the Broadening Top formation by Edwards & Magee’s Technical Analysis of the Stock Market. The Elliott Wave analysis would give us a triple zig zag. Both interpretations suggest that this pattern is “buying time.”
The time element in this equation has to do with Triple Witching Friday. Today is when options, futures and options on futures all expire simultaneously. The house wants to see those October put options to expire worthless, which apparently they will. If there was a large decline, options sellers would have to “gamma hedge” their positions by selling shares of stock in an already thin market. The same goes for futures and options on futures.
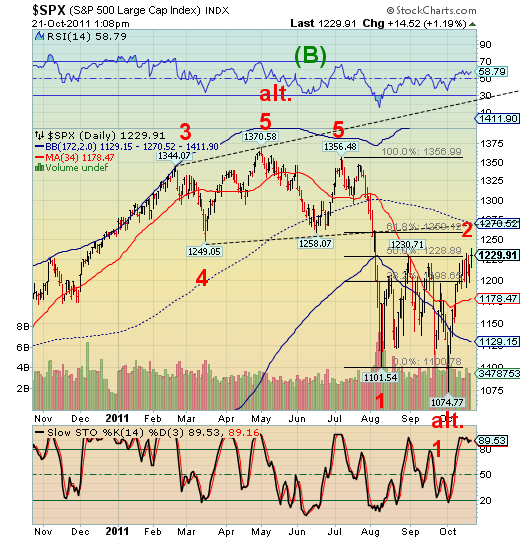
But the formation is storing up energy for the decline that follows, which may be a crash. The average decline beneath the lower trendline of a Broadening Formation is 20%, giving us a target of approximately 956. This is similar to the pattern that prompted me to call for a crash in early May, 2010.
There are so many iterations of the Elliott Wave count that it is hard to keep track of them all. But, as they say, all roads lead to Rome. That is to say, there is no doubt now that we are finishing a Wave 2. The Fibonacci retracement is a little more than 50% in either count and the retracement from the October 4 low has been 17 calendar days, or 13 trading days, a completed cycle.
The completed cycle of the May 2010 flash crash took only 10 days from high to low. The probability of a repeat of that experience is better than 50% at this time.
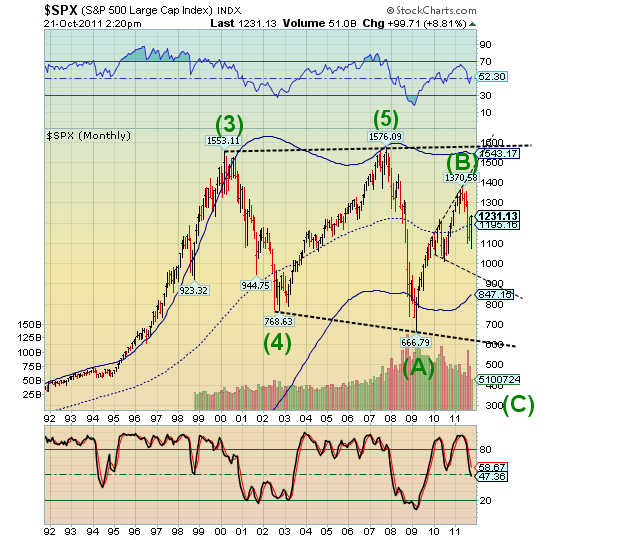
Now, for the big picture. We can see Broadening formations at all degrees of trend in the equities indexes, including monthly.
Another analyst, who will remained unnamed, is calling for a Head & Shoulders neckline at the 666 low in the SPX. The target of a Head & Shoulders pattern at that level results in a negative number. That is the basis of my disagreement with his analysis.
A Broadening Formation at the monthly level, however, yields an average target of 460. There is yet another analysis of the Elliott Wave relationships which posits that the most common relationship in an A-B-C formation is that A = C, (or, A seeks equality with C). This suggests that the average target for (C) may also be at or near 460.
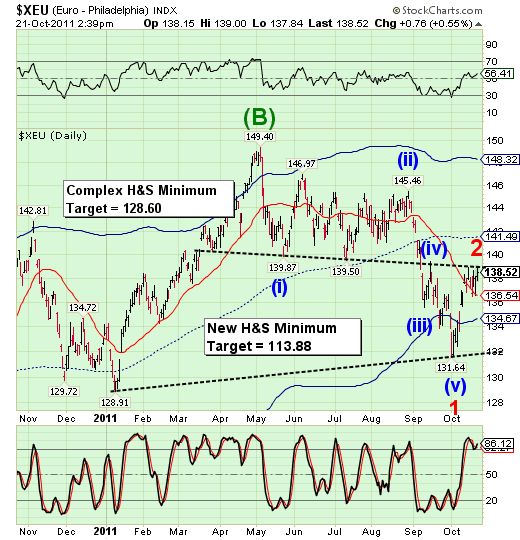
The $XEU (Euro) has run up against neckline resistance at 139.00 for the second time in a little over a week. Although the completed Head & Shoulders pattern failed to meet its downside target, Recent action has resulted in a second Head & Shoulders pattern that may result in a much more significant decline. Since there seems to be a rising correlation between the SPX and the XEU, I suggest that the XEU may also be preparing for a crash.
Have a great weekend!
Regards,
Tony
Our Investment Advisor Registration is on the Web
We are in the process of updating our website at www.thepracticalinvestor.com to have more information on our services. Log on and click on Advisor Registration to get more details.
If you are a client or wish to become one, please make an appointment to discuss our investment strategies by calling Connie or Tony at (517) 699-1554, ext 10 or 11. Or e-mail us at tpi@thepracticalinvestor.com .
Anthony M. Cherniawski, President and CIO http://www.thepracticalinvestor.com
As a State Registered Investment Advisor, The Practical Investor (TPI) manages private client investment portfolios using a proprietary investment strategy created by Chief Investment Officer Tony Cherniawski. Throughout 2000-01, when many investors felt the pain of double digit market losses, TPI successfully navigated the choppy investment waters, creating a profit for our private investment clients. With a focus on preserving assets and capitalizing on opportunities, TPI clients benefited greatly from the TPI strategies, allowing them to stay on track with their life goals
Disclaimer: The content in this article is written for educational and informational purposes only. There is no offer or recommendation to buy or sell any security and no information contained here should be interpreted or construed as investment advice. Do you own due diligence as the information in this article is the opinion of Anthony M. Cherniawski and subject to change without notice.
Anthony M. Cherniawski Archive |
© 2005-2022 http://www.MarketOracle.co.uk - The Market Oracle is a FREE Daily Financial Markets Analysis & Forecasting online publication.