


Volatile Stock Market May Surprise
Stock-Markets / Stocks Bear Market Oct 23, 2011 - 05:59 AM GMTBy: Tony_Caldaro

 The US markets had a choppy week, bouncing between SPX 1191/1197 and 1233/1239, but finished near the high for the week at 1238. World markets were mixed to lower. Economics reports for the week were mixed as well. On the improve: the PPI, the NAHB index, housing starts, the Philly FED, the M1 multiplier, the monetary base, and jobless claims declined. On the downtick: the NY FED, the CPI, building permits, existing home sales, leading indicators and the WLEI. Industrial production and capacity utilization came in unchanged. For the week the SPX/DOW were +1.25%, and the NDX/NAZ were -1.30%. Asian markets were all lower, European and Commodity equity markets were mixed, and the DJ World index gained 0.3%. Next week will be highlighted by Q3 GDP, Durable goods, PCE prices and Housing. Best to your week!
Grand Supercycles, Supercycles and Cycle waves
On wednesday, after a careful historical review, we posted the following:
Now that markets worldwide have declined anywhere from 22% (SPX/FTSE) to 43% (RTSI), we thought we would review the current market and place it into the proper historical perspective. In February 2010 we published this piece on the GSC: http://caldaro.wordpress.com/2010/02/14/grand-super-cycle-revisited%e2%80%8f/. We see no reason to change this view.
A quick recap. A multi-century Grand Supercycle topped in 1929 and ended with the Great depression and an 89% stock market collapse by 1932. After that a new multi-century GSC began. Each GSC bull market consists of five SuperCycle waves. The bull market SC’s are multi-decade events. The first of these SC bull markets ran from 1932-2007. This we labeled SC1. The two year bear market that followed, when the market lost over 55% of its value, we labeled SC2. At the March 2009, SPX 667 low, SuperCycle 3 began its multi-decade bull market. Notice the bear markets cycles take very little time to do major damage, i.e. 1929-1932 89% market loss, and 2007-2009 55% market loss.
Each SuperCycle bull market consists of five Cycle waves. During SC1, 1932-2007, the bull market Cycle waves lasted from five years (1932-1937) to 31 years (1942-1973) and 33 years (1974-2007). Notice the shortest was five years. Within each bull market Cycle wave there are five Primary waves. These Primary waves can last anywhere from two months (Jly32-Sept32) and five months (Feb33-July33), to 17 (1949-1966) and 18 years (1982-2000). You may already see where I’m heading with this.
When we review the 15 world market indices we track we find 9 have OEW confirmed bear markets, and the rest came close to confirming at the recent lows. The wave counts for their previous bull markets display seven with Primary wave I highs, followed by a Primary II bear market. The other eight display five wave structures, counted as a completed Cycle wave [1] into their bull market high, and then their bear markets. When we compare the historical bull market time relationships of Cycle waves (5 to 33 years) and Primary waves (2 months – 18 years), to these eight 2 year bull markets we find they are historically too short to be counted as completed Cycle waves. They look more like Primary waves. As a result of this analysis, all the world indices must have had a Primary wave I high to end their bull markets and then a Primary wave II bear market. We will be downgrading the current counts, by one degree, on all eight of these world indices. The ramifications of this “project, monitor, adjust” event will prove to be quite interesting. We will cover this at another time.
That time is now. As we continued our analysis, covering 1932-present, we reviewed all Primary waves for the entire period. What we found is quite interesting. Every rising Primary wave I or III, lasting from 5 months to 18 years in the study, was followed by a declining Primary wave II or IV of 1 year to 6 years. The shortest declining Primary wave, (July33-July34), followed the shorter rising Primary wave (Feb33-July33). Since our current Primary wave I lasted 26 months, we’re looking at a Primary wave II of at least 12 months. There’s more.
No less than 80% of the time, the Primary wave bull market high was retested, (within -3.5% to +1%), at some point during the B wave portion of the declining Primary wave. This would suggest the current B wave rally could rise to within 3.5% (SPX 1323) of the SPX 1371 bull market high, or even surpass it by 1% (SPX 1385). Then the C wave of the bear market would take over, returning the market to the A wave low or lower.
Most of the time, 60%, the final bear market wave structure is a flat. As a result of this study we have added two additional retracement ratios to the SPX daily chart. It appears, however, should this B wave exceed the 61.8% retracement level at SPX 1258 by 1% or 2%, the market is likely going to make a run at the bull market high. There is one caveat. Even though this study covers nearly 80 years of market data the actual Primary wave sample was small, only twelve waves.
In summary, our recent 26 month (Mar09-May11) Primary wave I bull market could be followed by a Primary wave II bear market lasting 1 to 6 years. Since bear markets are ABC wave structures, and the A wave ended in five months at SPX 1075, the current B wave could rally all the way back to the bull market high before the C wave takes over, and ends this bear market. This pattern can still fit within our scenario of the bear market ending in the spring 2012. It all depends on how long this B wave lasts.
The charts posted above are just some examples of how a Major B wave can unfold during a Primary wave II or IV bear market.
LONG TERM: bear market highly probable
Now that we have an historical backdrop on what can happen during this bear market. Let’s review what is actually occurring. After the SuperCycle SC2 low in March 2009 at SPX 667, the market embarked on a five wave Primary bull market. The market then topped in May 2011 at SPX 1371. Notice the MACD was rising and then stayed above neutral during the entire bull market, and the RSI was constantly getting overbought.
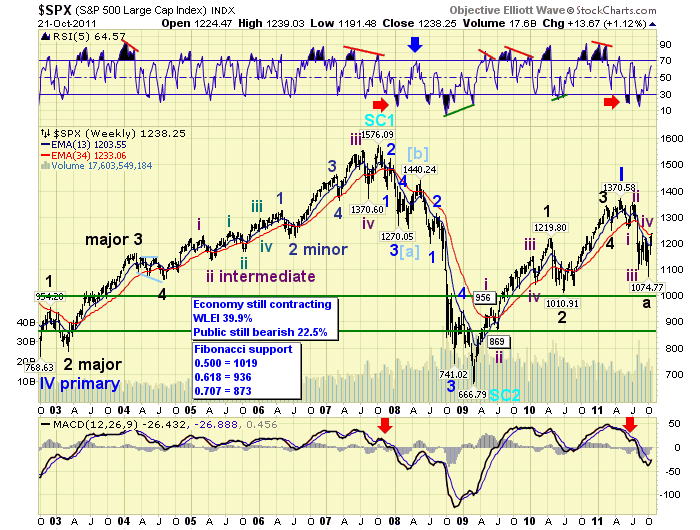
When the bull market completed we had a negative divergence on the RSI and the first downtrend became quite oversold. A similar thing occurred during the previous bull market (2002-2007). Then the MACD started to break down and head below neutral into bear market territory. These events are marked by the red arrows.
From the May11 SPX 1371 high the market did five waves down into a Major wave A low at SPX 1075. Notice the similarity in wave structure to the previous bear market. In Oct07 the market topped at SPX 1576 and did five waves down into a Cycle wave [a] low at SPX 1257. After this low both bear markets embarked on a B wave rally. The 2008 Cycle wave [b] rally lasted two months and retraced 57% of the Cycle wave [a] decline before entering a nasty Cycle wave [c]. Our current bear market Major wave B rally has already retraced 55% of its Major wave A decline in less than four weeks. That’s a big difference. While these two bear markets started in a similar fashion: five waves down in five months, declining 319 points versus 296 points. The current B wave uptrend is not only of a much lesser wave degree, but is moving twice as fast. This is not 2008!
MEDIUM TERM: uptrend high SPX 1239
When we review the daily chart we observe five Intermediate waves down from SPX 1371 to 1075. This week we lowered the wave count one degree from Major to Intermediate to fit our historical study posted above. Project, monitor, adjust. Intermediate wave one was the shortest, Intermediate wave three the longest, and Intermediate wave five ended in a diagonal triangle.
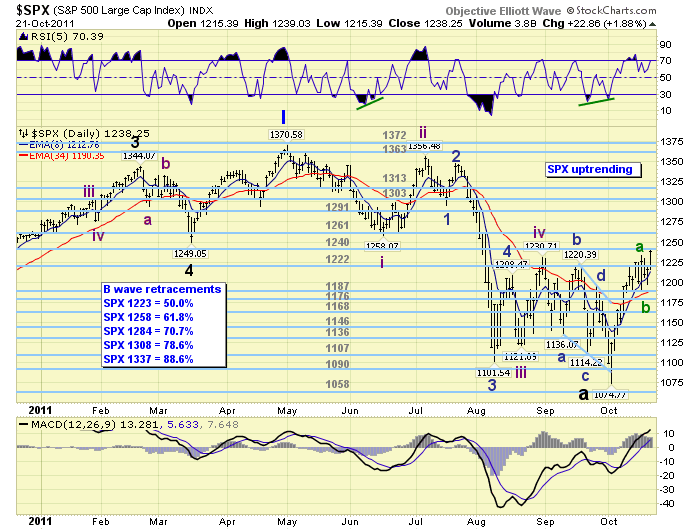
After a declining five wave structure the first line of resistance is the previous fourth wave, at Intermediate wave four or SPX 1231, which also represented about a 50% retracement. The current Major wave B uptrend ran into resistance around these levels and then edged above them on friday hitting SPX 1239. The next resistance level is at the 61.8% retracement and the Intermediate wave one low, which are both at SPX 1258. Oddly enough, the Cycle wave [a] low in 2008 was SPX 1257, and we also have a five year old OEW pivot at 1261. This area should offer heavy resistance.
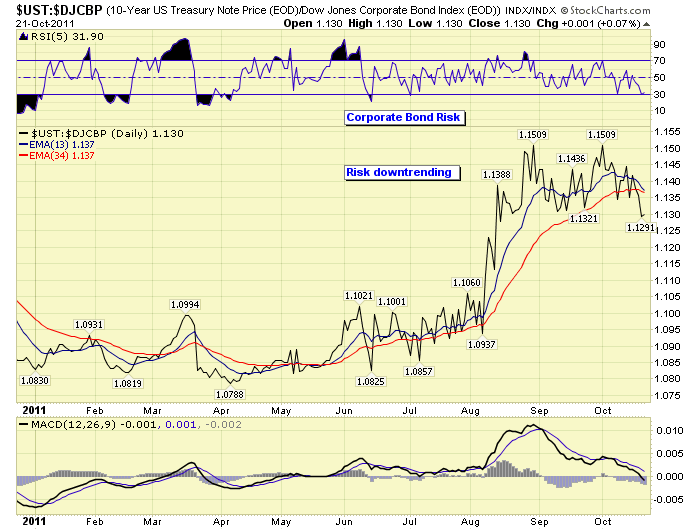
A couple of weeks ago we wrote about Secular bear cycles and Corporate bond risk: http://caldaro.wordpress.com/2011/10/08/weekend-update-313/. As expected, corporate bond risk has subsided somewhat with the current uptrend in equities, and there are still no signs of another potential 2008 event. The secular bear cycle continues.
SHORT TERM
Support for the SPX has notched back up to the 1222 and 1187 OEW pivots, with resistance now at the 1240 and 1261 pivots. Short term momentum is currently sitting at overbought. The internal wave count of this very quick rally has been a bit difficult to track. These sort of rallies usually occur in bull markets, and only sometimes in B wave rallies of bear markets. Nevertheless, we can now count five waves up from SPX 1075 to 1225, and have labeled that high with a tentative wave A. The pullback to SPX 1191, that followed, we have labeled with a tentative wave B. This uptrend should now be in a wave C.
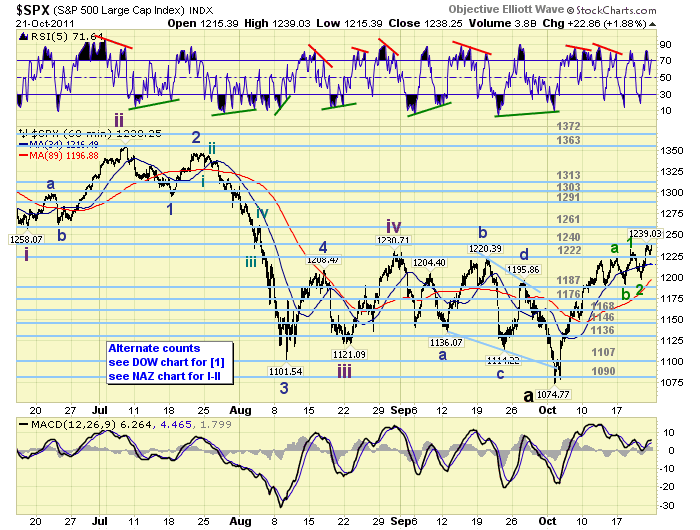
This wave C appears to be dividing into a more defined five wave structure. We have placed a wave 1 at SPX 1233, a wave 2 at 1197, and wave 3 should be underway now. If this wave C has a 0.50 relationship to wave A is should end around SPX 1266. This is in line with the resistance cluster between SPX 1257 and the OEW 1261 pivot already mentioned. Should C have a 0.618 relationship to A then SPX 1284 would be next. This level fits exactly with a 70.7% retracement of the entire Major wave A, and is close to the OEW 1291 pivot. Anything above SPX 1300, and we’re probably looking at an eventual retest of the 1371 bull market high. Quite a wild market. And, definitely a stock pickers market. One last note. The two previous uptrends, June and August, were 15 days and 18 days, respectively, in duration. This uptrend is currently 14 days old. Something to keep in mind as we enter the upcoming week. Best to your trading!
FOREIGN MARKETS
The Asian markets were all lower on the week for a net loss of 2.3%. None of these indices are in confirmed uptrends yet.
The European markets were mixed for a net loss of 0.4%. All of these indices are in confirmed uptrends.
The Commodity equity group were mostly higher on the week but a net loss of 0.1%. Again no confirmed uptrends here either.
The DJ World index gained 0.3% on the week, and has not confirmed an uptrend either.
COMMODITIES
Bonds continue to downtrend after the record low 1.70% yield on the 10YR, but gained 0.4% on the week.
Crude remains quite volatile, gained 0.2% on the week, but a confirmed uptrend looks likely after two waves down of $25.00 each.
Gold has had a rough time getting an uptrend going. It lost 2.2% on the week. Typically with the risk trade on, due to debt monetization, stocks, commodities and gold rise, while bonds and the USD decline. With market expectations of an upcoming European debt monetization program, one would expect the same asset movement except with possibly the Euro declining instead of the USD. This is currently not occurring. It is possible Gold investors are waiting for the official announcement, or the European bank bailout program, and backstop, does not currently include monetized debt at all. Time will tell.
The USD lost 0.3% on the week, and has been declining after displaying negative divergences at the $80 DXY high. The EUR gained 0.1% on the week, while the JPYUSD hit an all time high gaining 1.2%.
NEXT WEEK
A busy economic calendar ahead which kicks off on tuesday with Case-Shiller, Consumer confidence, and FHFA housing prices. On wednesday we have Durable goods orders and New home sales. Then on thursday weekly Jobless claims, Q3 GDP, and Pending home sales. Friday ends the week with Personal income/spending, PCE prices, and Consumer sentiment. Nothing appears on the FED schedule at this time. FED governor Duke’s weekend speech was just released: http://www.federalreserve.gov/newsevents/speech/duke20111022a.htm. Best to your weekend and week.
CHARTS: http://stockcharts.com/...
http://caldaroew.spaces.live.com
After about 40 years of investing in the markets one learns that the markets are constantly changing, not only in price, but in what drives the markets. In the 1960s, the Nifty Fifty were the leaders of the stock market. In the 1970s, stock selection using Technical Analysis was important, as the market stayed with a trading range for the entire decade. In the 1980s, the market finally broke out of it doldrums, as the DOW broke through 1100 in 1982, and launched the greatest bull market on record.
Sharing is an important aspect of a life. Over 100 people have joined our group, from all walks of life, covering twenty three countries across the globe. It's been the most fun I have ever had in the market. Sharing uncommon knowledge, with investors. In hope of aiding them in finding their financial independence.
Copyright © 2011 Tony Caldaro - All Rights Reserved Disclaimer: The above is a matter of opinion provided for general information purposes only and is not intended as investment advice. Information and analysis above are derived from sources and utilising methods believed to be reliable, but we cannot accept responsibility for any losses you may incur as a result of this analysis. Individuals should consult with their personal financial advisors.
© 2005-2022 http://www.MarketOracle.co.uk - The Market Oracle is a FREE Daily Financial Markets Analysis & Forecasting online publication.