


U.S. October Employment Situation Means Fed Can Watch From the Sidelines, For Now
Economics / Unemployment Nov 05, 2011 - 03:50 AM GMTBy: Asha_Bangalore

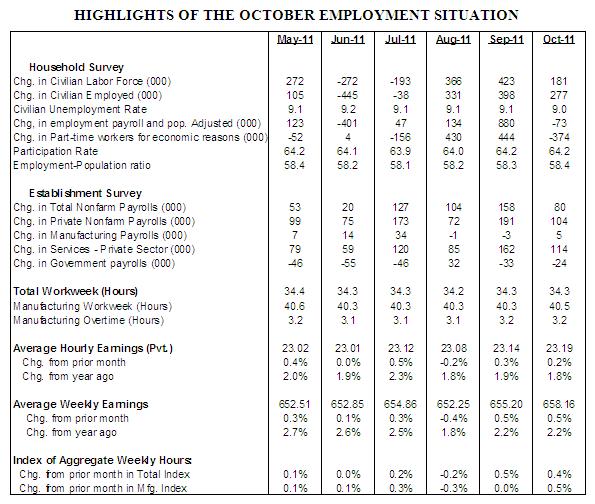
 Civilian Unemployment Rate: 9.0% in October, down from 9.1% in September. Cycle high jobless rate for the recent recession is 10.1% in October 2009.
Payroll Employment: +80,000 jobs in October vs. +158,000 in September. Private sector jobs increased 104,000 after a gain of 191,000 in September. Addition of 102,000 jobs after revisions to payroll estimates of August and September
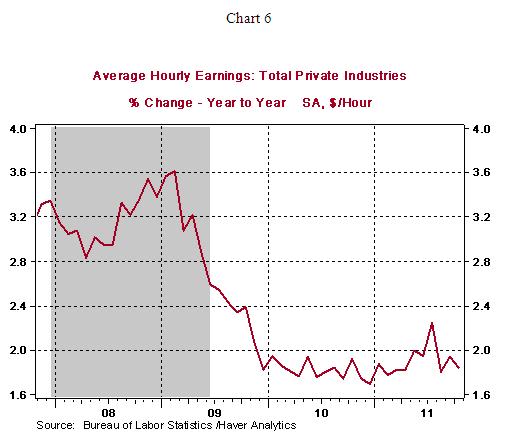
Private Sector Hourly Earnings: $23.19 in October vs. $23.14 in September; 1.8% y-o-y increase in October vs. 1.9% gain in September.
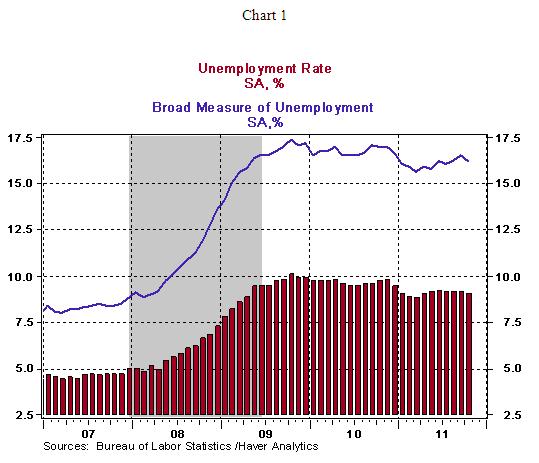
Household Survey – The unemployment rate edged down to 9.0% in October from 9.1% in September. The broad measure of unemployment fell to 16.2% from 16.5% in September. The broad measure of unemployment is a sum of the officially unemployed plus those working part-time because they cannot find full-time jobs and those who want to work but have not looked for a job in the past year.
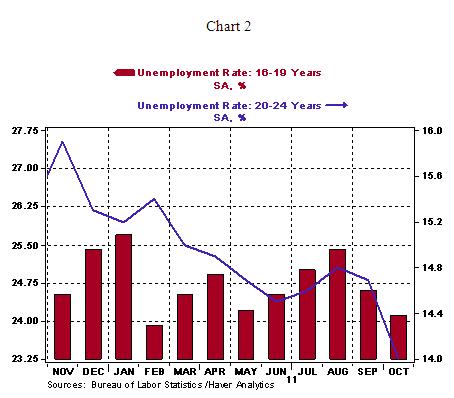
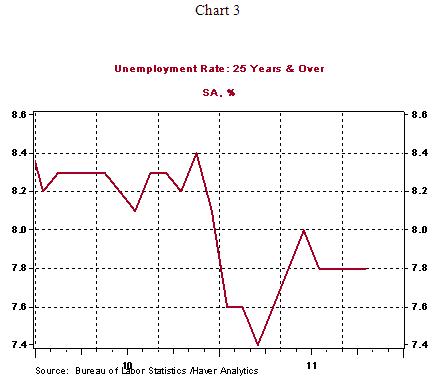
Fewer teenagers were unemployed in October (24.1% vs. 24.6% in September) and the jobless rate of folks in the 20-24 years age group also fell in October (14.0% vs. 14.7% in September, see Chart 2). The unemployment rate of workers aged 25 years and over has held steady for four straight months at 7.8% (see Chart 3). These data emphasize that the improvement in the jobless rate is concentrated in two categories and it is not broad based.
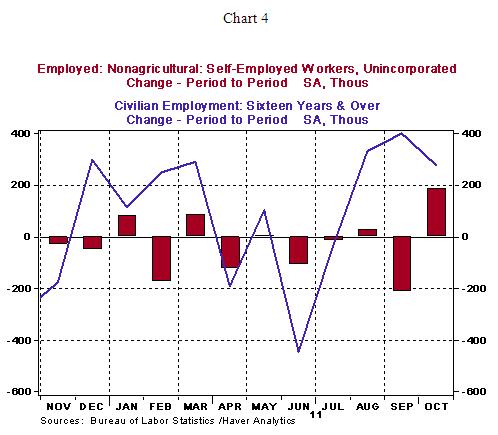
Another interesting aspect of the October employment report is that part-time employment fell but the number of self-employed rose, such that it accounted for a large part of the improvement in employment (see Chart 4). Thus, the household survey indicates that teenagers, self-employed, and those aged 20-24 years made up the increase in employment during October.
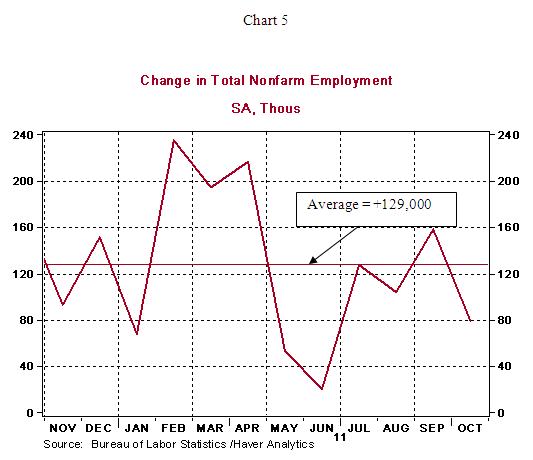
Establishment Survey – Nonfarm payroll employment increased 80,000 in October, following upward revisions to estimates of employment in August and September. The upward revisions added 102,000 new jobs. In the past twelve months, payroll employment averaged 129,000, which is sufficient to match the increase in the labor force but inadequate to make a dent in the current soft status of the labor market.
Highlights of changes in payrolls during October 2011:
Construction: -20,000 vs. +27,000 in September
Manufacturing: +5,000 vs. -3,000 in September
Private sector service employment: +104,000 vs. +191,000 in September
Retail employment: +18,000 vs. +13,000 in September
Professional and business services: +32,000 vs. +50,000 in September
Temporary help: +15,000 vs. +21,100 in September
Financial activities: +4,000 vs. -5,000 in September
Health care: +11,600 vs. +45,000 in September
Government: -24,000 vs. -33,000 in September
The average workweek held steady and hourly earnings rose 5 cents to $23.19 in October, putting the year-to-year change at 1.8%. The contained trend of hourly earnings is not supportive of the inflationary concerns of the hawks in the FOMC. The increase in employment and earnings bodes positively for an increase in the wage and salary component of personal income in October. The 0.5% increase in the manufacturing man-hours index, after a string of three consecutive monthly readings that were unchanged, points to a jump in factory production in October.
Conclusion – In the third quarter, real GDP rose at an annual rate of 2.5%. Gains in new home sales and housing starts and a drop in sales of existing homes during September paint a mixed picture of housing market conditions. More recent incoming economic data suggest the U.S. economy is muddling through. In October, auto sales increased and the factory sector chugged along at a lackluster pace according to the ISM manufacturing survey. If this scenario continues to play out in November, there is little reason for the Fed to engage in any new accommodative policies at the December 13 FOMC meeting. The catalyst for additional net asset purchases by the FOMC will likely be weaker exports due to the recession in the eurozone and the growth slowdown in developing economies. These signs should be visible in the early months of 2012 and prompt the Fed’s third round of large-scale asset purchases.
Asha Bangalore — Senior Vice President and Economisthttp://www.northerntrust.com
Asha Bangalore is Vice President and Economist at The Northern Trust Company, Chicago. Prior to joining the bank in 1994, she was Consultant to savings and loan institutions and commercial banks at Financial & Economic Strategies Corporation, Chicago.
Copyright © 2011 Asha Bangalore
The opinions expressed herein are those of the author and do not necessarily represent the views of The Northern Trust Company. The Northern Trust Company does not warrant the accuracy or completeness of information contained herein, such information is subject to change and is not intended to influence your investment decisions.
© 2005-2022 http://www.MarketOracle.co.uk - The Market Oracle is a FREE Daily Financial Markets Analysis & Forecasting online publication.