


Gold Price Action Remains Overall Bullish
Commodities / Gold and Silver 2011 Nov 06, 2011 - 03:51 AM GMTBy: Merv_Burak

 Nothing much has really happened since my last post a few weeks back. Yes, gold went down a little and up a little but no real move of significance. I’m not yet sure if such lack of real action is positive or negative. Only time will tell. In the mean time let’s see how we ended the week.
GOLD
LONG TERM
Trend: Things happen slowly as far as the long term perspective is concerned. The gold price touched my long term moving average line a few times over the past month or two and even closed below the line on two occasions but the line had remained in a positive direction throughout. At the close on Friday gold is once more above its long term moving average line and the line slope remains in a positive direction.
Strength: The long term momentum indicator has been moving in a basic lateral direction these past several weeks. This does not suggest strength in the price movement, up or down. The indicator has, however, remained in its positive zone throughout and remains above its positive sloping trigger line.
Volume: The volume indicator is in even more of a lateral trend than the momentum indicator. Although the momentum indicator did break (slightly) above its October levels the volume indicator has not been able to do so. It remains below its October peaks. It is also below its negative sloping trigger line. Not an encouraging sign.
Despite some not too encouraging technical signs the overall combination of indicators continue to give me a BULLISH rating at the Friday close.
INTERMEDIATE TERM
Trend: Since breaking above its earlier October peaks two weeks ago gold has been in an upward trend although the daily moves have been highly susceptible to global political events. At the Friday close gold has once more moved above its intermediate term moving average line. The moving average line has been in a lateral phase over the past couple of weeks but has shown a very slight positive slope at the Friday close.
Strength: Over the past month and a half the intermediate term momentum indicator has been toying with its neutral line moving above and below the line on a few occasions. For the past two weeks it has remained above the neutral line in the positive zone although the move is still very restrained. It has remained above its positive sloping trigger line but not much above and a day or two of negative action could easily put the indicator below its trigger.
Volume: The volume indicator crossed above its trigger line a couple of weeks ago but that didn’t last. It has since moved below and above the line again. Not the actions of a very positive trend. At the Friday close the volume indicator is sitting right on top of its trigger line with the trigger still in a negative slope.
As with the long term despite some negative indicators the sum total still gives me a BULLISH rating at the Friday close. This is confirmed by the short term moving average line which has just moved above the intermediate term line.
SHORT TERM

From a short term standpoint it has been a decent couple of weeks, not great but decent. From here gold must surge or else it may be back to the down side as may be guessed by the very short term FANs shown. That third FAN trend line may be seen as a very short term blow-off stage as soon as the price drops below the line. In the mean time let’s see how gold ended the week.
Trend: Any one of those FAN trend lines may be viewed as short term trend lines with gold above them all. Gold closed the week above its short term moving average line with the line slope in a positive direction.
Strength: The short term momentum indicator is tracing a similar path to that of the price, however, it is not showing any great strength to the move. It is, for now, above its positive sloping trigger line in its positive zone.
Volume: The daily volume action is on the verge of pathetic. It is relatively very low and below its average volume over the past 15 days. This is not a sign of speculative interest. Regardless of the price move you need that speculative interest for the move to have any longevity.
For now the indicators still add up to a short term BULLISH rating at the Friday close. This is confirmed by the very short term moving average moving above the short term one.
As for the immediate direction of least resistance, that should be the down side either on Monday or very soon. The Stochastic Oscillator is once more in its overbought zone and is underperforming the price move. We could have a very short term negative divergence here should the price move below that third FAN trend line.
SILVER
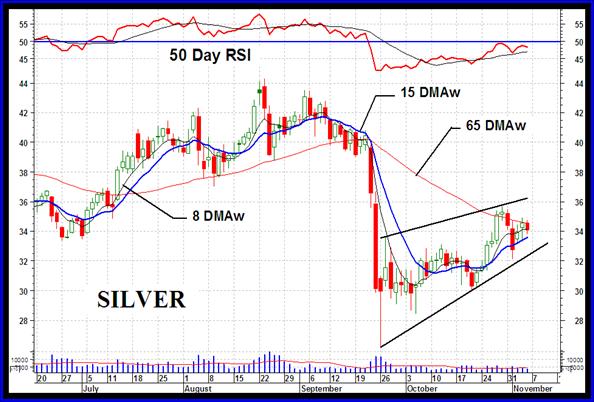
First we had a “box” pattern, then we had a triangular pattern, now we have an upward sloped wedge pattern. One of these day’s I’ll get it right. In the mean time the pattern is now a wedge with an upward tilt. These patterns are very often bearish pattern when they follow a bear trend. It works like a mid-way rest period or consolidation before the bear trend continues. Is that what will happen here? Only time will tell.
LONG TERM
Trend: Silver price is below its long term moving average line and the line is moving lower.
Strength: The long term momentum indicator is just above its neutral line and above its positive sloping trigger line.
Volume: The volume indicator did not take a severe plunge as did the price in Sept but at the same time it is not acting that great during the very recent advance. It is, however, above its positive sloping trigger line at the Friday close.
With the actions of the momentum and volume indicators the rating of silver at the Friday close is a – NEUTRAL rating, one level above a full bear.
INTERMEDIATE TERM
Trend: Although the price has recently been on the move higher it has not quite breached its intermediate term moving average line. It remains below the average line with the line still in a downward slope.
Strength: The intermediate term momentum has been on the rise recently and is above its positive sloping trigger line but the indicator has not quite made it into its positive zone just yet.
Volume: For the past two weeks the volume indicator has remained above its intermediate term trigger line and the trigger remains in a positive slope.
Despite the positive showing by the volume indicator it is not enough to overcome the other indicators. At the Friday close the intermediate term rating is still BEARISH. This bear is confirmed by the short term moving average line remaining below the intermediate term average, although the two are closing in on each other pretty fast.
SHORT TERM
Trend: Silver price has been above its short term moving average line for a couple of weeks but now looks to be close to moving below the line. Still, at the Friday close it remains above the line with the line in a positive slope.
Strength: The short term momentum indicator has entered its positive zone but as yet does not look that strong. It has moved below its trigger line although the trigger remains in a slightly positive slope.
Volume: As with gold the daily volume action here is relatively low and not the kind of activity one likes to see if we are looking for a strong bull move in the price.
Putting it all together the short term rating, at the Friday close, is BULLISH with the very short term moving average line confirming.
The immediate direction of least resistance seems to be towards the down side although the indicators are not as strong here as with gold, but silver should follow gold.
Merv’s Non-Edibles Futures Indices Table
For weekly information and commentary on gold and silver stock Indices and Merv’s 190 gold and silver stocks please go to the subscribers section at http://preciousmetalscentral.com.
Well, that’s it for this week. Comments are always welcome and should be addressed to mervburak@gmail.com.
By Merv Burak, CMT
Hudson Aero/Systems Inc.
Technical Information Group
for Merv's Precious Metals Central
For DAILY Uranium stock commentary and WEEKLY Uranium market update check out my new Technically Uranium with Merv blog at http://techuranium.blogspot.com .
During the day Merv practices his engineering profession as a Consulting Aerospace Engineer. Once the sun goes down and night descends upon the earth Merv dons his other hat as a Chartered Market Technician ( CMT ) and tries to decipher what's going on in the securities markets. As an underground surveyor in the gold mines of Canada 's Northwest Territories in his youth, Merv has a soft spot for the gold industry and has developed several Gold Indices reflecting different aspects of the industry. As a basically lazy individual Merv's driving focus is to KEEP IT SIMPLE .
To find out more about Merv's various Gold Indices and component stocks, please visit http://preciousmetalscentral.com . There you will find samples of the Indices and their component stocks plus other publications of interest to gold investors.
Before you invest, Always check your market timing with a Qualified Professional Market Technician
Merv Burak Archive |
© 2005-2022 http://www.MarketOracle.co.uk - The Market Oracle is a FREE Daily Financial Markets Analysis & Forecasting online publication.