Stock Market SP 500 1,215 & 1,191 Key Support
Stock-Markets / Stock Markets 2011 Nov 11, 2011 - 03:22 AM GMTBy: Chris_Ciovacco
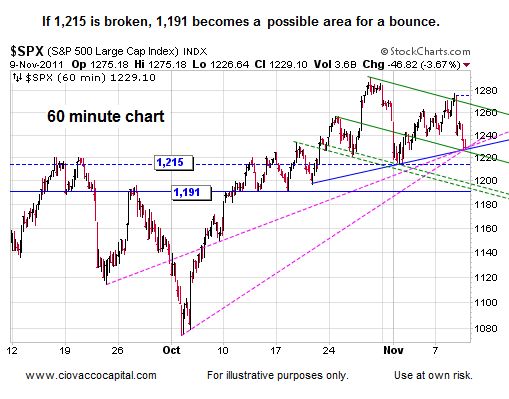
 As shown in the chart below, the S&P 500 held at a logical level on Wednesday. Even if stocks eventually break the October 4 lows, another push as high as 1,313 is possible. 1,215 is a widely watched level for the bulls, but 1,191 is also an important area of possible support.

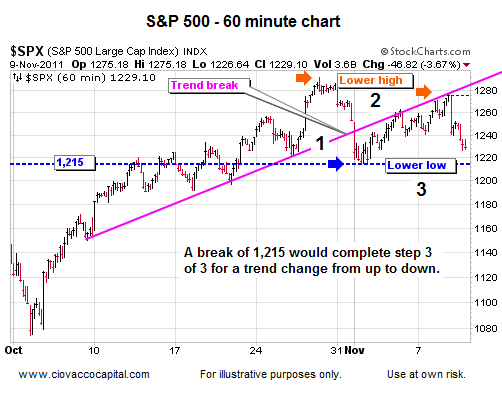
Two of the three steps for a trend change have taken place (see below): (1) price broke the upward sloping trendline in early November and (2) a lower high was made (compare orange arrows). Step three would be to make a lower low via a break of 1,215. A close above 1,244ish would reduce the odds of testing 1,215 in the short run.

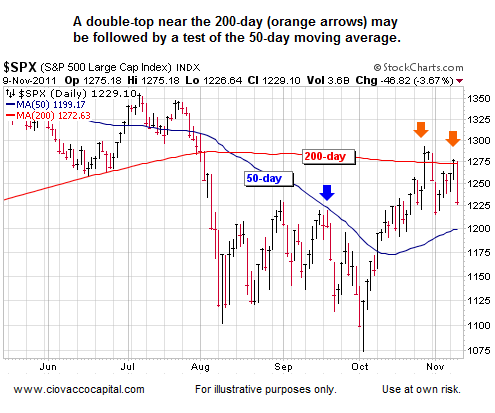
The S&P 500 has made two unsuccessful attempts to clear its 200-day moving average (see orange arrows).

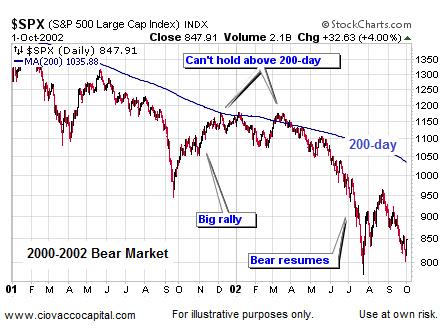
It is not uncommon for a bear market to make several runs at and/or above the 200-day moving average. The chart below shows one example from the dot-com bust. Notice the slope of the 200-day is down-to-flat in the chart below, which is very similar to the present day.

A clear, forceful (volume), and sustained break of the 200-day (1,273) would increase the odds of stocks going on to make significant higher highs. Given slowing global growth, serious problems in Europe and central bankers with a limited menu of options, stocks have a lot to overcome. It is important that we keep an open mind since bear markets tend to end when things still look very bad fundamentally.
If you are bullish, you want to see silver (SLV) outperform gold (GLD) – you also want inflation to win out over deflation. The silver ETF is still having trouble with its 50-day (34.06) and more importantly is stalling in the gap between 32.54 and 34.51, just as it did in 2008 (see analysis). If SLV can close above 34.92 and hold above, it would be an important bullish signal for inflation and risk assets.
Some points on Italy from Thursday’s Wall Street Journal:
The latest escalation fed fears that the euro-zone debt crisis is starting down its most perilous path: going from a storm raging among small countries at Europe’s fringe to one that strikes a major economic power.
From there, the risks to the global economy are broad. The European and U.S. financial systems are deeply intertwined, and Europe is a major export market for American companies.
“We are in a war economy,” said Giovanni De Censi, chairman of Italy’s Credito Valtellinese bank, in an interview with Italy’s Radio 24 Wednesday. “I’ve never seen anything like it, liquidity has disappeared.”
Italy’s debt load of €1.9 trillion ($2.6 trillion) is the second largest in Europe, behind Germany’s, and the fourth largest in the world. Next year, more than €300 billion of debt comes due, and Italy must continually tap markets to refinance it.
But the underlying worries run much deeper: Italy has a massive public-debt burden and a chaotic political system that is ill-prepared to solve it. European policy makers, who have long bickered over how to protect the Continent from an Italian-size problem, are now facing one with no solution in hand.
Big investors felt comfortable owning big stakes of Italian debt in part because they knew they could sell without much difficulty. That has changed. “It used to be one of the most liquid markets out there, but it isn’t anymore,” said Peter Schaffrik, head of European rates strategy at RBC Capital Markets in London. Not long ago, an investor had little problem buying or selling €500 million of Italian bonds at a clip, he said. “Now it’s difficult to trade more than €50 million.” The worsened trading conditions have led to more-exaggerated moves.
Unlike Ireland and Portugal, Italy is far too large to be rescued by the euro zone’s bailout fund. That means there is no backstop if Italy is unable to raise money in the markets.
-
Copyright (C) 2011 Ciovacco Capital Management, LLC All Rights Reserved.
Chris Ciovacco is the Chief Investment Officer for Ciovacco Capital Management, LLC. More on the web at www.ciovaccocapital.com
Ciovacco Capital Management, LLC is an independent money management firm based in Atlanta, Georgia. As a registered investment advisor, CCM helps individual investors, large & small; achieve improved investment results via independent research and globally diversified investment portfolios. Since we are a fee-based firm, our only objective is to help you protect and grow your assets. Our long-term, theme-oriented, buy-and-hold approach allows for portfolio rebalancing from time to time to adjust to new opportunities or changing market conditions. When looking at money managers in Atlanta, take a hard look at CCM.
All material presented herein is believed to be reliable but we cannot attest to its accuracy. Investment recommendations may change and readers are urged to check with their investment counselors and tax advisors before making any investment decisions. Opinions expressed in these reports may change without prior notice. This memorandum is based on information available to the public. No representation is made that it is accurate or complete. This memorandum is not an offer to buy or sell or a solicitation of an offer to buy or sell the securities mentioned. The investments discussed or recommended in this report may be unsuitable for investors depending on their specific investment objectives and financial position. Past performance is not necessarily a guide to future performance. The price or value of the investments to which this report relates, either directly or indirectly, may fall or rise against the interest of investors. All prices and yields contained in this report are subject to change without notice. This information is based on hypothetical assumptions and is intended for illustrative purposes only. THERE ARE NO WARRANTIES, EXPRESSED OR IMPLIED, AS TO ACCURACY, COMPLETENESS, OR RESULTS OBTAINED FROM ANY INFORMATION CONTAINED IN THIS ARTICLE. PAST PERFORMANCE DOES NOT GUARANTEE FUTURE RESULTS.
Chris Ciovacco Archive |
© 2005-2022 http://www.MarketOracle.co.uk - The Market Oracle is a FREE Daily Financial Markets Analysis & Forecasting online publication.


