


Stock Market Breaks Support, Heading Lower
Stock-Markets / Stock Markets 2011 Nov 25, 2011 - 02:23 AM GMTBy: UnpuncturedCycle

 When I last sent out an article for public consumption we were talking about Greece and the potential for a wide spread problem in Europe. The G-20 was about to meet and there was wild anticipation that a EU “solution” to the sovereign debt crisis was finally at hand. By now we know that Europe has yet to do anything to alleviate the situation. In the US we learned two days ago that the “Super Committee” was a super bust. They weren’t able to agree on anything so a series of automatic cuts, to be implemented two years down the road, totaling US $1 trillion will take place. That’s a far cry from the US $3.7 trillion that they were aiming for and is typical of the political leadership on both sides of the pond.
In our November 1st report I took a look at China as they announced the implementation of monetary easing just months after announcing a policy of monetary tightening. That is something that central banks hate to do because it’s an admission that a mistake has been made. As you can see below, the easing produced a momentary surge in the Shanghai Exchange:
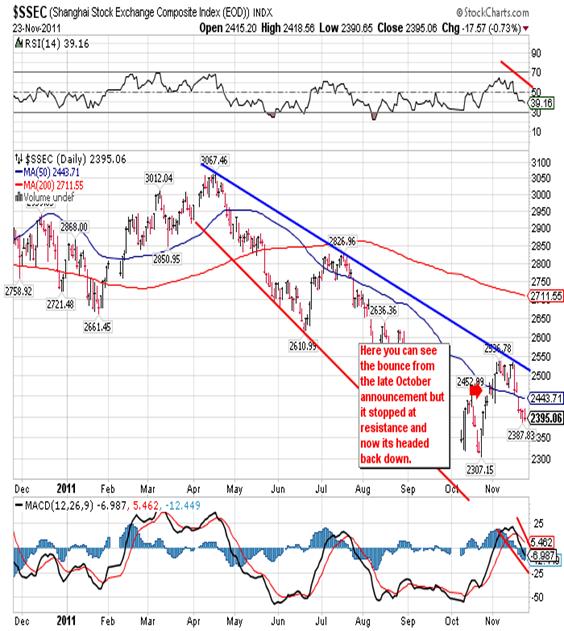
Unfortunately the move higher didn’t last, stopping at resistance as you can see in the chart, and has now turned back down. We can also see that RSI, MACD and the histogram are all headed lower and late last week we saw a gap down on the open that remains unfilled. So since the November 1st report we can say that things have gotten worse instead of better.
In the previous report we also looked at the French market and as you can see things have deteriorated:
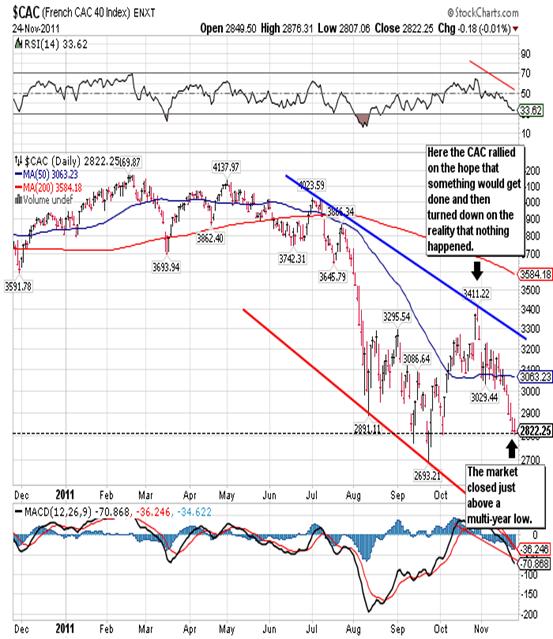
Here we have something similar to China only worse. We see the October surge on high hopes something will get done and then the fall as reality sets in. This morning we see that the CAC 40 closed marginally above the September multi-year low.
In Europe we’ve seen the contagion spread once again from Greece to Italy and then on to Portugal, Ireland, Spain and France. As if that’s not bad enough we saw a failed German bond auction on Wednesday and the ECB was forced to by 35% of the offer! This didn’t get a lot of publicity but it is extremely important that the economic backbone of the EU was not even close to filling a bond offer!
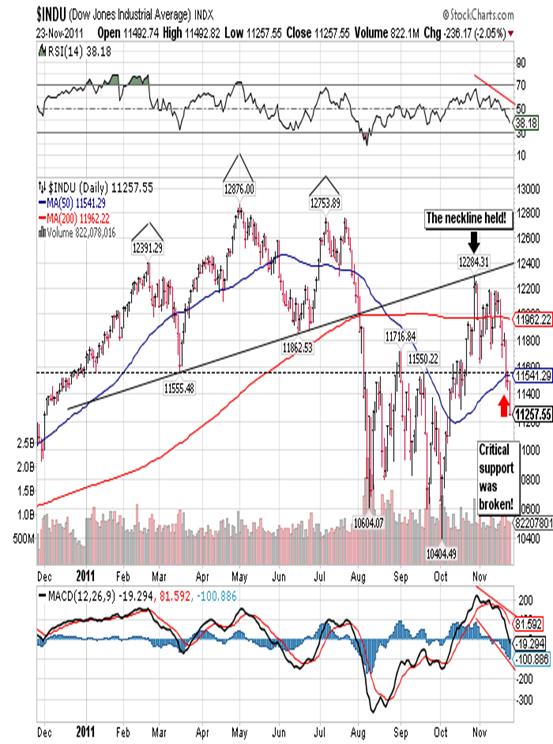
Then we have the Dow pictured above. When I did the November 1st report the Dow closed at 11,655 on that particular day. This was followed by a move up to 12,200 and a subsequent decline culminating in yesterday’s 237-point loss to end the session at 11,257. It appears that not much has gone on but appearances can be deceiving. There are three important things to take away from this chart:
- At no time could the Dow breakout above the all-important neckline resulting from the head-and-shoulders formation pictured above.
- Once the neckline was tested the Dow fell to test strong support at 11,555 and it failed to hold.
- The RSI, MACD and histogram all are headed down hard.
I suppose I should also mention that the Dow is now back down below the 50-dma and things look dismal to say the least.
It is also interesting to note that The Dow has now posted two 90% down days in the last three sessions and there has been little or no attempt to buy the market. Usually a 90% down day indicates an exhaustion of the urge to sell and is followed by two to seven days of buying before a return to the trend down. That is not the case here although we do see attempts to support the market or push it higher during the night, but they run out of steam as soon as the Dow opens for business in New York.
Now we’ll take a look at the Dow’s counterpart, the Transportation Index, in an effort to see if they are moving together:
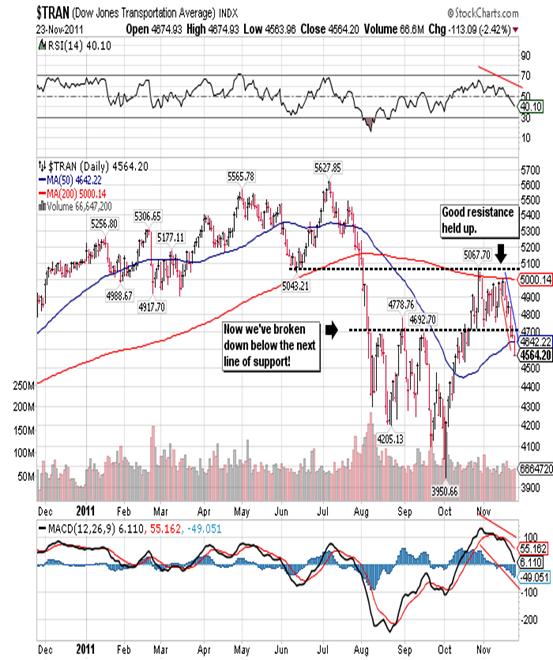
You can see an almost identical pattern here as key resistance held and then key support failed. It should be noted that on days the Dow posts a triple-digit decline the Transports always posted a bigger decline percentage wise. Wednesday is a perfect example as the Dow fell 2.05% while the Transports tumbled 2.42%. This has become the rule since the April high.
In conclusion the markets haven’t changed all that much compared to the 1st of November but the potential for a significant decline is increasing with each passing day. The Dow’s close below the critical support at 11,555 is an indication that we’re going lower, more than likely down to test the next layer of strong support at 10,710. The Dow is not yet extremely oversold so we can get there without a big struggle. Sooner or later there will be a rebound, more than likely three to four sessions, and as a result of short covering once we get close to the 10,710 support. I remain convinced that the path of least resistance is lower and that we’ll see new lows before Christmas. Of course there will be manipulation and rumors of “solutions” but it won’t change anything as no one is willing to make the right decisions.
Giuseppe L. Borrelli
www.unpuncturedcycle.com
theunpuncturedcycle@gmail.com
Copyright © 2011 Giuseppe L. Borrelli
- All Rights Reserved Disclaimer: The above is a matter of opinion provided for general information purposes only and is not intended as investment advice. Information and analysis above are derived from sources and utilising methods believed to be reliable, but we cannot accept responsibility for any losses you may incur as a result of this analysis. Individuals should consult with their personal financial advisors.
© 2005-2022 http://www.MarketOracle.co.uk - The Market Oracle is a FREE Daily Financial Markets Analysis & Forecasting online publication.