


U.S. Housing Market Overview
Housing-Market / US Housing Dec 20, 2011 - 02:56 PM GMTBy: Mike_Stathis

 The real estate market continues to show little signs of life. Despite record-low mortgage rates and a collapse in home prices, builders see little demand for new homes due to the record-high overhang of existing homes on the market, including the record-high level of foreclosed properties (4.29% of all active loans) which have continued to gain most attention from buyers due to much lower prices.
Even more disturbing is that the fact new foreclosures are outpacing foreclosure sales by a factor of 3 to 1. This means that the existing home inventory due to foreclosures is growing by 3 times the rate of foreclosure sales.
But there may be some relief in sight for the rapid flood of foreclosed properties hitting the market. Due to the robo-signing and foreclosure gate scandals, foreclosures are setting new records in with respect to the time it takes for these properties to be processed through the legal system. The average loan in foreclosure has now been delinquent a record 631 days.
To some, it would appear that the easiest way to save a good deal of money would be to simply stop paying their mortgage (and property taxes) and live rent free for a couple of years.
Economists insist that a healthy housing market is the key to an economic recovery because it creates jobs. After previous recessions, housing accounted for at least 15% of economic growth in the United States. Since the official end of the recession in June 2009, it has contributed only 4%. Economists have pointed to this data to explain why the economy shows no signs of recovery.
Economists look closely at new homes sales even though these sales only comprise 20% of the total because new home construction is thought to have a much larger impact on the economy. According to the National Association of Home Builders, each home built creates an average of three jobs for a year and generates about $90,000 in tax revenue.
Although we here at AVA Investment Analytics feel this claim is exaggerated, the more important issue is that a healthy real estate market does not lead to a truly healthy economy unless such an economy. A healthy real estate market is a consequence of a healthy economy because homebuyers need good stable jobs to afford a home. Robust creation of good jobs holds the key to a healthy economy.
Most economists view the huge size of foreclosure inventory to be the main problem in the housing market. The reason for this widely-held view is due to the fact that when these properties are added to the existing inventory and future existing inventory (expected to be persistently large for many years) it creates downward price pressure on the total housing market. For instance, the median price of a new home is about 30% higher than the median price for an existing home. Under normal conditions new homes sell for 15% higher than comparable existing homes.
We view this downward pricing pressure as a positive for the real estate market since it makes homes more affordable since many areas of the U.S. still suffer from excessive real estate pricing. The problem is that banks have raised lending standards to address responsible borrowing practices. Thus, this renewed prudence exhibited by the banks is inconsistent with the nation’s overall economic strategy. The result is a disconnect between Washington’s economic strategy and the lending practices of the banks. This inconsistency is being permitted by Washington so that banks can mend their balance sheets.
Delays in the foreclosure process due to the mortgage gate and robo-signing scandals have created an enormous backlog of pending foreclosures. Moreover, the loan modification programs by Washington continue to be ineffective. For instance, repeat foreclosures made up nearly 45% of new foreclosures in October. According to the Office of the Comptroller of the Currency, of the 2.1 million modifications made since 2008, more than 10% were in foreclosure; another 27.4% were delinquent 30 or more days, as of the end of October 2011.
According to the Commerce Department, in October builders began construction on a seasonally adjusted annual rate of 628,000 homes, which is about one-half the amount characteristic of a healthy housing market.
In 2009 new home construction collapsed to a 50-year low of 554,000 units. In 2010, construction on new units rose to 587,000. Thus, 2011 is not likely to be much better.
Notably, building permits increased by 11% in October. This was driven by a 30% increase in apartment permits which are now at a three-year high. For 2011 alone, apartment permits have increased by 63%. In contrast, single family permits increased by only 6.6%.
Construction for single-family homes, which make up about 70% of residential home construction, rose nearly 4% in October. However, single-family construction has remained flat since 2009. In contrast, apartment construction has trended upward since 2009, but declined by more than 13% in October.
The growth in new apartment construction makes sense when we consider millions who have lost their home due to foreclosure, millions of lost jobs and millions who have gone from working from full to part-time. The trend of apartment construction implies that large developers realize the U.S. economy stands no chance of healing anytime soon.
While some have welcomed the rise in apartment permits in 2011, economists have kept silent knowing that the decline in single-family development has been much more severe.
New home sales in October showed a slight uptick from the previous month as the median home sales price declined by 0.4% from September to the lowest level in 2011 at $212,300.
Despite the increasing number of single-family homes on the market, the annual rate of new home sales for 2011 trails that of 2010, which was the worst year of new home sales since the government began recording the data in 1963.
This worrisome trend has remained largely without any signs of improvement despite substantial downward price pressures as a result of the huge number of foreclosures and record-low mortgage rates.
According to the Commerce Department, new-home sales increased 1.3% in October to a seasonally adjusted annual rate of 307,000, or less than half the 700,000 thought required to sustain a healthy housing market. New home sales data for September was also revised downward.
The number of new homes for sale in the U.S. fell to a record-low in October of 162,000 as builders continue to struggle with less expensive existing properties.
Even with record-low mortgage rates, the existing home sales market remains worrisome. The seasonally adjusted rate of total home sales as of the end of October was only 4.97 million units, which is slightly higher than the 14-year low in total sales made in 2010.
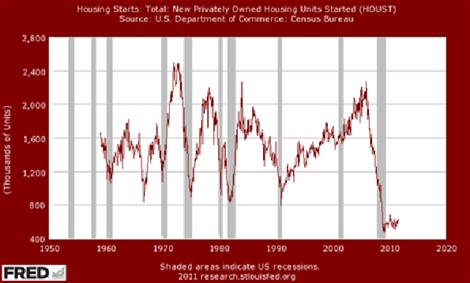
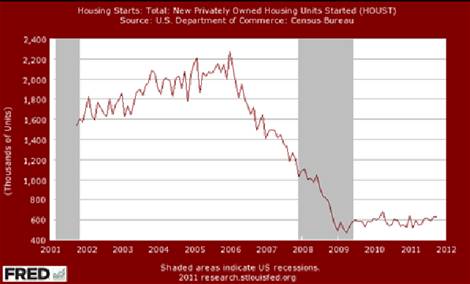
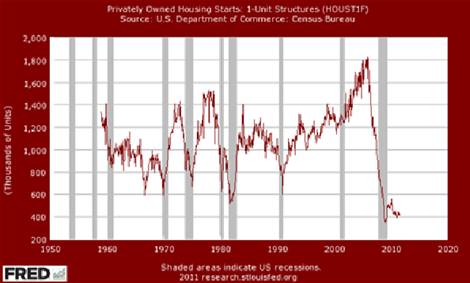
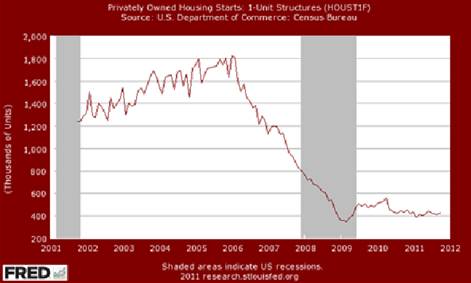
The accompanying charts illustrate current trends in the housing market.
Chart 1 shows total housing starts since inception of recorded data. Chart 2 shows total housing starts over the past ten years. As you can see, total starts have shown very little growth since the official end of the recession and only a slight increase from the bottom reached in 2009.
Charts 3 and 4 show housing starts for 1-unit structures since inception and over the past ten-year period respectively. As you can appreciate, 1-unit starts have actually declined since the official end of the recession and are approaching their 2009 lows.
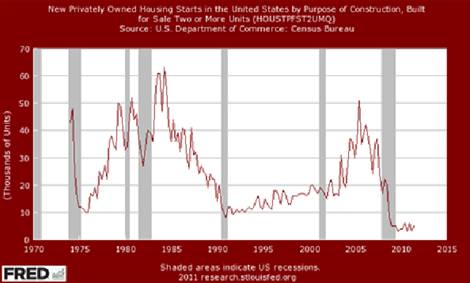
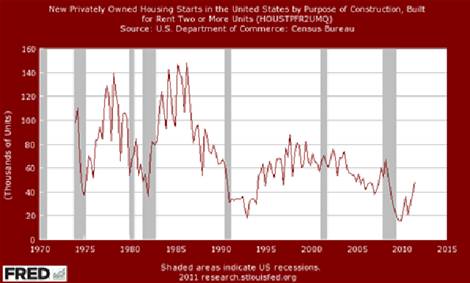
Below, we see that starts for 2 or more units built for sale are flat (although up in October), while starts for 2 or more units built for renting are trending upward.
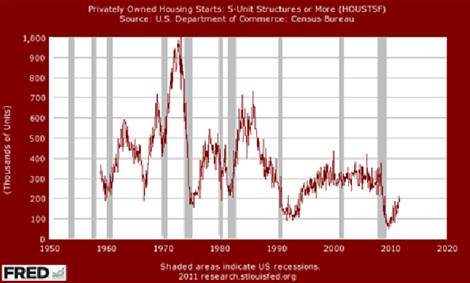
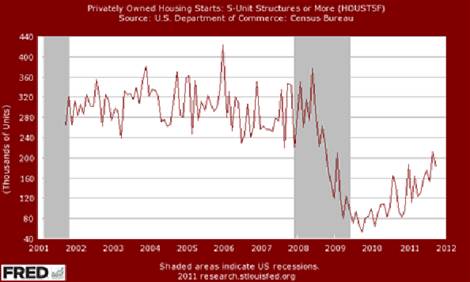
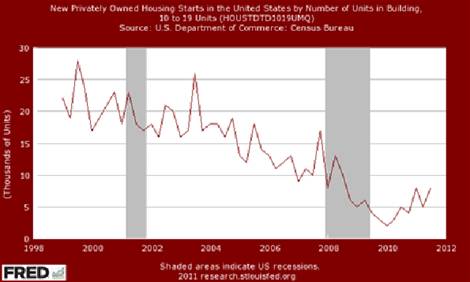
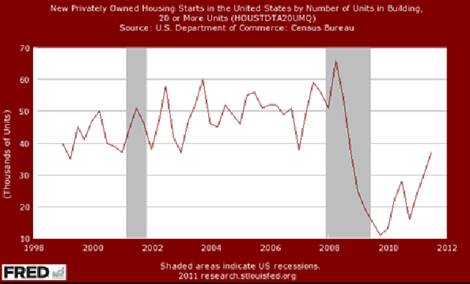
The next four charts show that 5-unit, 10-19 unit and 20 or more unit housing starts have been on an uptrend since the official end of the recession.
In other words, the trend in housing construction is with rental units.
The final chart shows the historical data since inception (1999) of average square footage for single family homes. As you can see, by the end of 2004 the average home size had soared, peaking at 2540 by late 2007.
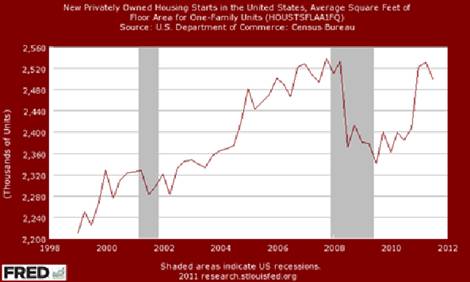
Immediately after the official end of the recession, the average square footage collapsed to a multi-year low of 2340. However, by early 2011, the average square footage of a single family home soared again to 2530, just shy of the all-time highs made just prior to the official onset of the recession. This is shocking.
The trend of larger homes was discussed as part of the problem with the real estate bubble in America’s Financial Apocalypse. One would have thought that by now, builders would realize that going forward, things will be very different in America.
Much in the same way that the banks have not learned from this historic collapse, it appears that builders have also failed to learn much if anything.
Based on continued weakness in the housing market, we feel that the average square footage for single-family homes will test the lows made right after the official end of the recession, and could very well set new lows over the next few years.


By Mike Stathis
www.avaresearch.com
Copyright © 2011. All Rights Reserved. Mike Stathis.
Mike Stathis is the Managing Principal of Apex Venture Advisors , a business and investment intelligence firm serving the needs of venture firms, corporations and hedge funds on a variety of projects. Mike's work in the private markets includes valuation analysis, deal structuring, and business strategy. In the public markets he has assisted hedge funds with investment strategy, valuation analysis, market forecasting, risk management, and distressed securities analysis. Prior to Apex Advisors, Mike worked at UBS and Bear Stearns, focusing on asset management and merchant banking.
The accuracy of his predictions and insights detailed in the 2006 release of America's Financial Apocalypse and Cashing in on the Real Estate Bubble have positioned him as one of America's most insightful and creative financial minds. These books serve as proof that he remains well ahead of the curve, as he continues to position his clients with a unique competitive advantage. His first book, The Startup Company Bible for Entrepreneurs has become required reading for high-tech entrepreneurs, and is used in several business schools as a required text for completion of the MBA program.
READ THIS LEGAL NOTIFICATION IF YOU INTEND TO REPUBLISH ANY PORTION OF THIS MATERIAL
Market Oracle has received permission rights to publish this article. Any republications of this article or any others by AVA Investment Analytics must be approved by authorized staff at AVA Investment Analytics. Failure to do so could result in legal actions due to copyright infringement.
Our attorneys have determined that the so-called “Fair Use” exemption as it applies to the Digital Millennium Copyright Act does not permit use by websites that have ads or any other commercial application.
In addition, fair use does not imply articles can be republished or reproduced. The distinction between fair use and infringement may be unclear and not easily defined. There is no specific number of words, lines, or notes that may safely be taken without permission. Acknowledging the source of the copyrighted material does not substitute for obtaining permission. Please see this statement from the U.S. Copyright office for more information. http://www.copyright.gov/fls/fl102.html
Requests to the Publisher for permission or further information should be sent to info@apexva.com
Books Published
"America's Financial Apocalypse" (Condensed Version) http://www.amazon.com/...
"Cashing in on the Real Estate Bubble" http://www.amazon.com/...
"The Startup Company Bible for Entrepreneurs" http://www.amazon.com...
Disclaimer: All investment commentaries and recommendations herein have been presented for educational purposes, are generic and not meant to serve as individual investment advice, and should not be taken as such. Readers should consult their registered financial representative to determine the suitability of all investment strategies discussed. Without a consideration of each investor's financial profile. The investment strategies herein do not apply to 401(k), IRA or any other tax-deferred retirement accounts due to the limitations of these investment vehicles.
© 2005-2022 http://www.MarketOracle.co.uk - The Market Oracle is a FREE Daily Financial Markets Analysis & Forecasting online publication.