


Friday The 13th Stock Market Scare
Stock-Markets / Stock Markets 2012 Jan 14, 2012 - 06:24 AM GMTBy: Jay_DeVincentis

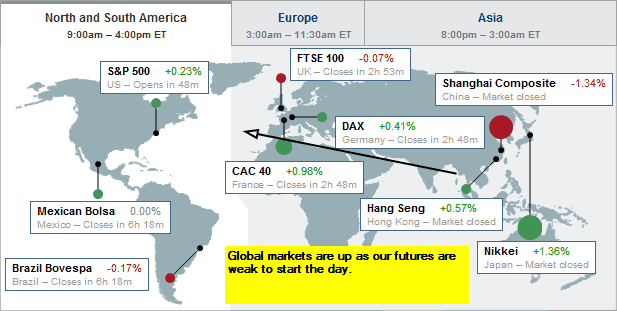
 As we approach a long weekend, I was leaning bullish for an extension of the rally into next week which is also options expiration. That changed this am as we had euro concerns causing a jump in the dollar and bonds and corresponding weakness in stocks and commodities. With the market near highs, profit taking is also a consideration.
The dollar moved first, bonds are catching up right now (in the short term).
But as the markets set up for the open, there should be a bounce from very short term oversold conditions (I'm talking on an hourly basis). How that bounce plays out will determine how we close. When would the buying trigger? I generally look to key price levels and key time pivots. There's also a report at 9:55. That's lines up pretty well.
So if yesterday was a key reversal day, why didn't we go short? The barometer is an end of day type system. It needs weakness to position us short, just as it needs strength to position us long. So we may be acting today, more likely sometime next week.
Here's a look at the global markets:
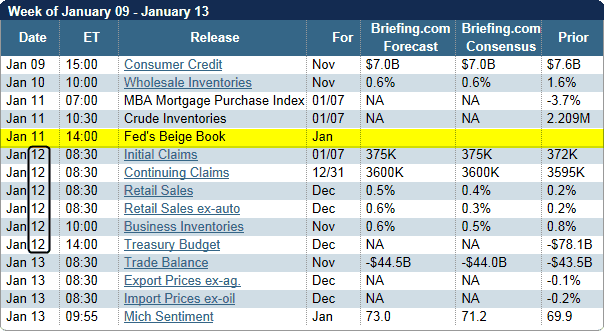
On the economic front, here is the schedule for this week. Pay close attention to the timing of the report and the potential for the markets to make short term reversals at those points.
On to the charts:
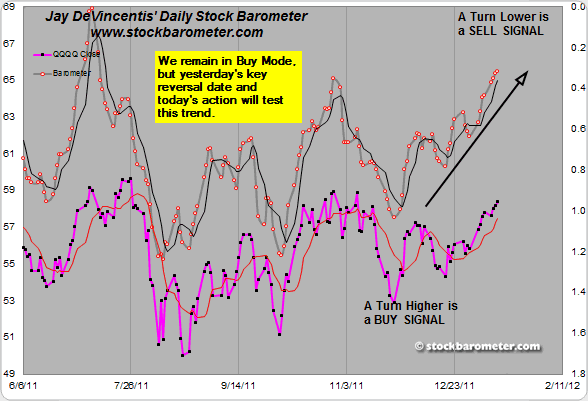
Stock Barometer Analysis
The barometer remains in Buy Mode. Today's action may put us into Sell Mode. However, we'll need closing data to make a decision. Note Monday is a holiday and next Friday is options expiration.
The Stock Barometer is my proprietary market timing system. The direction, slope and level of the Stock Barometer determine our outlook. For example, if the barometer line is moving down, we are in Sell Mode. A Buy or Sell Signal is triggered when the indicator clearly changes direction. Trend and support can override the barometer signals.
Money Management & Stops
To trade this system, there are a few things you need to know and address to control your risk: • This system targets intermediate term moves, of which even in the best years, there are usually only up to 7 profitable intermediate term moves. The rest of the year will be consolidating moves where this system will experience small losses and gains that offset each other. • This system will usually result in losing trades more than 50% of the time, even in our best years. The key is being positioned properly for longer term moves when they come. • Therefore it is vitally important that you apply some form of money management to protect your capital. • Trading a leveraged index fund will result in more risk, since you cannot set stops and you cannot get out intraday.
Accordingly; • Make sure you set your stops so that you can lose no more than 2% per trade (based on the QQQQ if you're trading leveraged funds and options with our trading service).
Potential Cycle Reversal Dates
2012 Potential Reversal Dates: 1/12, 1/27, 2/16. We publish dates up to 2 months in advance.
I am bullish into 1/12. What would be ideal is a market that peaks into 1/12, then turns lower into the 27th. I'd like to grab both those moves.
My Additional timing work is based on numerous cycles and has resulted in the above potential reversal dates. These are not to be confused with the barometer signals or cycle times. However, due to their past accuracy I post the dates here.
2011 Potential Reversal Dates: 1/15, 1/29, 2/16, 3/10, 3/18, 4/6, 5/21, 5/31, 6/13, 6/24, 7/16, 8/1, 8/19, 9/4, 9/25, 10/21, 10/25, 11/25, 12/26.2010 Potential Reversal Dates: 1/19, 1/28, 3/2, 3/23, 4/7, 5/30, 6/10, 6/28, 7/10, 8/13, 9/7, 10/2, 10/27, 11/21, 12/19. 2009 Published Reversal Dates: 1/20, 2/11, 3/7, 3/15, 4/8, 4/16, 4/27, 5/7, 6/8, 7/2, 7/17, 9/14, 10/10, 10/24, 11/12, 11/30, 12/9, 12/21, 12/29. 2008 Potential Reversal Dates: 12/31, 1/11, 2/1, 2/13, 3/6, 4/5, 4/22, 5/23, 6/6, 6/27, 7/13, 9/2, 10/3, 10/22, 11/10, 12/11. 2007 Potential Reversal Dates: 1/10, 1/14, 1/27, 1/31, 2/3, 2/17, 3/10, 3/24, 4/21, 5/6, 6/15, 8/29, 10/19, 11/29, 12/13, 12/23, 12/31, 1/11/08. 2006 potential reversal dates: 1/16, 1/30, 2/25, 3/19, 4/8, 5/8, 5/19, 6/6(20), 7/24, 8/20, 8/29, 9/15, 10/11, 11/28. 2005 Potential reversal dates: 12/27, 1/25, 2/16, 3/4, 3/14, 3/29, 4/5, 4/19, 5/2, 6/3, 6/10, 7/13, 7/28, 8/12, 8/30-31, 9/22, 10/4, 11/15, 11/20, 12/16.
Timing Indicators
Use the following Timing/momentum indicators to assist in your trading of the QQQQ, GLD, USD, USO and TLT. They are tuned to deliver signals in line with the Stock Barometer and we use them only in determining our overall outlook for the market and for pinpointing market reversals. The level, direction, and position to the zero line are keys in these indicators. For example, direction determines mode and a buy signal 'above zero' is more bullish than a buy signal 'below zero'.
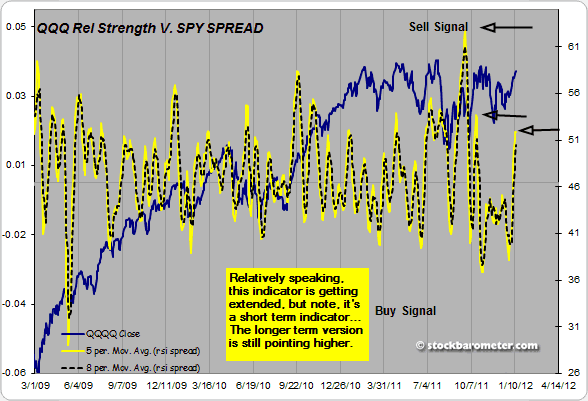
QQQQ Timing Indicator (NASDAQ:QQQQ)
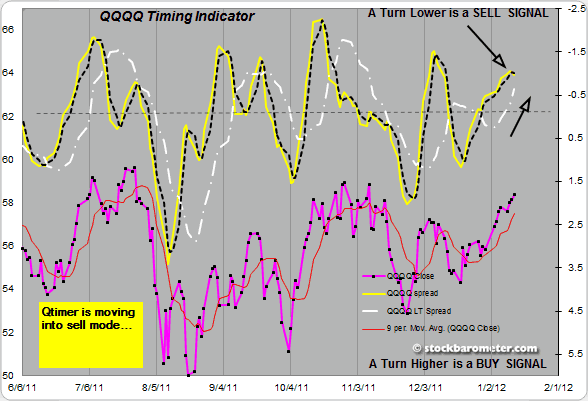
The QQQQ Spread Indicator will yield its own buy and sell signals that may be different from the Stock Barometer. It's meant to give us an idea of the next turn in the market.
Gold Timing Indicator (AMEX:GLD)
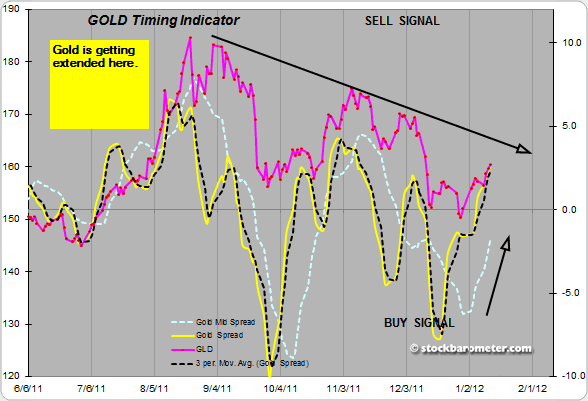
Want to trade Gold? Use our signals with the Gold ETF AMEX:GLD. Gold gives us a general gage to the overall health of the US Economy and the markets.
US Dollar Index Timing Indicator (INDEX:DXY)
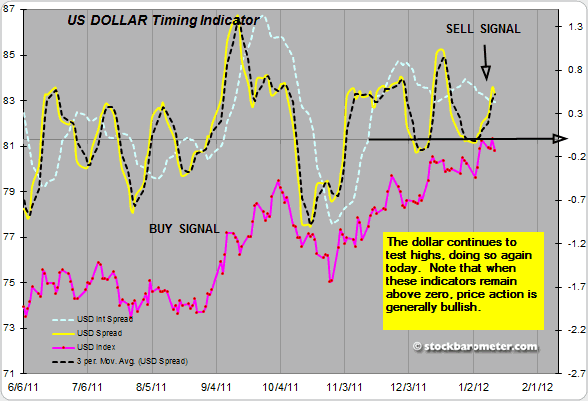
Want to trade the US Dollar? Use our signals with the Power Shares AMEX:UUP: US Dollar Index Bullish Fund and AMEX:UDN: US Dollar Index Bearish Fund.
Bonds Timing Indicator (AMEX:TLT)
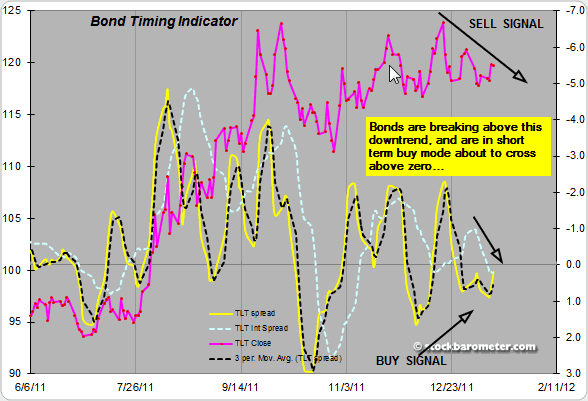
Want to trade Bonds? Use our signals with Lehman?s 20 year ETF AMEX:TLT. The direction of bonds has an impact on the stock market. Normally, as bonds go down, stocks will go up and as bonds go up, stocks will go down.
OIL Timing Indicator (AMEX:USO)
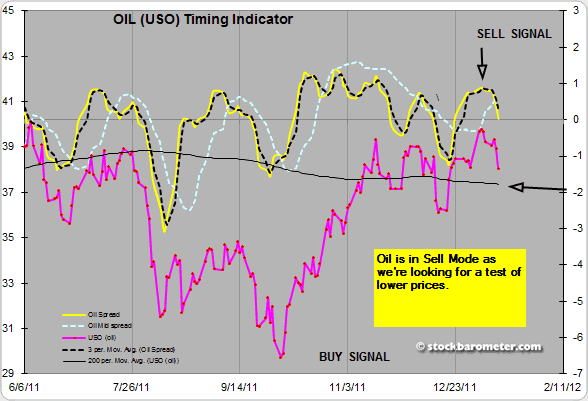
Want to trade OIL? Use our signals with AMEX:USO, the OIL ETF. We look at the price of oil as its level and direction has an impact on the stock market.
Secondary Stock Market Timing Indicator
We daily monitor hundreds of popular and proprietary technical indicators that break down market internals, sentiment and money flow to give us unique insight into the market. We feature at least one here each day in support of our current outlook.
As an annual subscriber to any of our premium services, you also get access to all our charts and research. Email Carl@stockbarometer.com to upgrade and also save 20% on your subscription.
Daily Stock Market Outlook
We remain in Buy Mode, on the back end of a key reversal date. This morning's action suggests we're moving into sell mode, watch for a recovery though throughout the day.
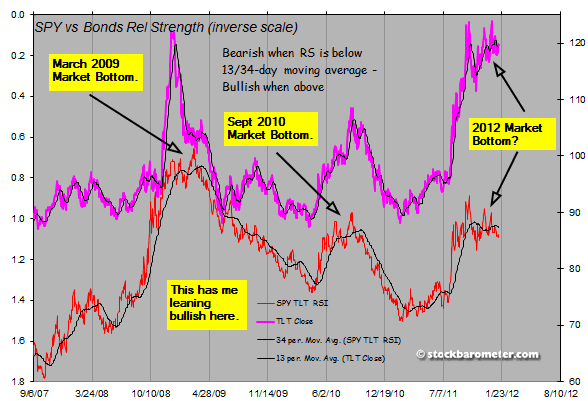
Above shows the action of the bonds and SPY - generally, big picture, this shows a lot of bullish potential longer term. That's if bonds reverse lower, which they eventually, historically, have done...
An update to a chart we've been showing below:
Also note we get the ECRI data on Saturday am. It's at a critical level. I'd like to see it bounce. We'll update it next week.
If you want to learn more about some of my models, I use my blog to cover them in more detail.
We also offer a daily blog and you can follow our blog posts on on Twitter and on Facebook. We also offer a free weekly indicator chart if you visit our home page and scroll to the bottom. This chart will be updated each week, so be sure to check back frequently for updates. www.stockbarometer.com - don't forget to scroll to the bottom.
As always, if you have any questions or comments, feel free to email me here at jay@stockbarometer.com.
Regards,
By Jay DeVincentis
Stock Barometer Premier Membership Receive 5 Newsletters, including the Daily Stock Barometer, Stock Options Speculator, QQQQ/Rydex Trader, Market Chat & Explosive Stock Alert FOR ONE LOW PRICE.
Important Disclosure
Futures, Options, Mutual Fund, ETF and Equity trading have large potential rewards, but also large potential risk. You must be aware of the risks and be willing to accept them in order to invest in these markets. Don't trade with money you can't afford to lose. This is neither a solicitation nor an offer to buy/sell Futures, Options, Mutual Funds or Equities. No representation is being made that any account will or is likely to achieve profits or losses similar to those discussed on this Web site. The past performance of any trading system or methodology is not necessarily indicative of future results.
Performance results are hypothetical. Hypothetical or simulated performance results have certain inherent limitations. Unlike an actual performance record, simulated results do not represent actual trading. Also, since the trades have not actually been executed, the results may have under- or over-compensated for the impact, if any, of certain market factors, such as a lack of liquidity. Simulated trading programs in general are also subject to the fact that they are designed with the benefit of hindsight. No representation is being made that any account will or is likely to achieve profits or losses similar to those shown.
Investment Research Group and all individuals affiliated with Investment Research Group assume no responsibilities for your trading and investment results.
Investment Research Group (IRG), as a publisher of a financial newsletter of general and regular circulation, cannot tender individual investment advice. Only a registered broker or investment adviser may advise you individually on the suitability and performance of your portfolio or specific investments.
In making any investment decision, you will rely solely on your own review and examination of the fact and records relating to such investments. Past performance of our recommendations is not an indication of future performance. The publisher shall have no liability of whatever nature in respect of any claims, damages, loss, or expense arising out of or in connection with the reliance by you on the contents of our Web site, any promotion, published material, alert, or update.
For a complete understanding of the risks associated with trading, see our Risk Disclosure.
© 2012 Copyright Jay DeVincentis - All Rights Reserved
Disclaimer: The above is a matter of opinion provided for general information purposes only and is not intended as investment advice. Information and analysis above are derived from sources and utilising methods believed to be reliable, but we cannot accept responsibility for any losses you may incur as a result of this analysis. Individuals should consult with their personal financial advisors.
© 2005-2022 http://www.MarketOracle.co.uk - The Market Oracle is a FREE Daily Financial Markets Analysis & Forecasting online publication.