


Stock Market Reversal is Due
Stock-Markets / Stock Markets 2012 Jan 23, 2012 - 04:13 AM GMTBy: Andre_Gratian

 SPX: Very Long-term trend - The very-long-term cycles are down and, if they make their lows when expected, there will be another steep and prolonged decline into 2014.
SPX: Intermediate trend - Intermediate uptrend still intact, but short-term top... or more, is now very close.
Analysis of the short-term trend is done on a daily basis with the help of hourly charts. It is an important adjunct to the analysis of daily and weekly charts which discusses the course of longer market trends.
Market Overview
Last week, the rally in the stock market got a reprieve. Two key indicators which were giving bearish signals did not follow through and turned back down. This probably means that an intermediate reversal is not immediately upon us and, even if the SPX makes a final high around 1322, it may be followed by a distribution period before a significant decline begins.
Next week should bring about a short-term top, and these are some of the reasons why:
-- The Point &Figure chart of the SPX is giving us several projections which converge between 1321 and 1324.
-- This is a resistance level where several important trend lines are intersecting, indicating that at least a pause in this area is due.
-- The hourly indicators are suggesting that this might be more than a pause, and a short-term correction instead.
-- In addition to the two contrary indicators mentioned above, UUP (the dollar ETF) is telling us that it probably needs some additional short-term consolidation. But the P&F base that the dollar has formed over the past few weeks suggests that it can go up to about 90 (which would be about 25 on UUP), and that this is only a pause in an intermediate uptrend.
-- The SentimenTrader is flashing a warning which is normally given at important market tops.
-- Cycles are topping in this area.
-- A recent article by Ed Carlson (Seattle Technical Advisors) published on Financial sense mentioned that several George Lindsay indicators were converging on January 23 (next Monday).
The above, in conjunction with an overbought daily MSO and negative divergence in the daily A/D indicator, is saying to the bulls: "Be cautious!"
Chart analysis
The Daily SPX Chart illustrates the strength displayed by the index since mid-December. In addition to positive seasonal influences, daily bullish economic reports have done nothing to reverse the uptrend, but several cycles which are topping in this area are probably the real reason for the market's steady upward push. Their influence should become less of a factor starting next week.
I have drawn on the chart several trend lines that should offer resistance to the price as it tries to move higher. The principal one is the dark red one which starts at the October 2007 top and connects with the 1370 high, in May of last year.
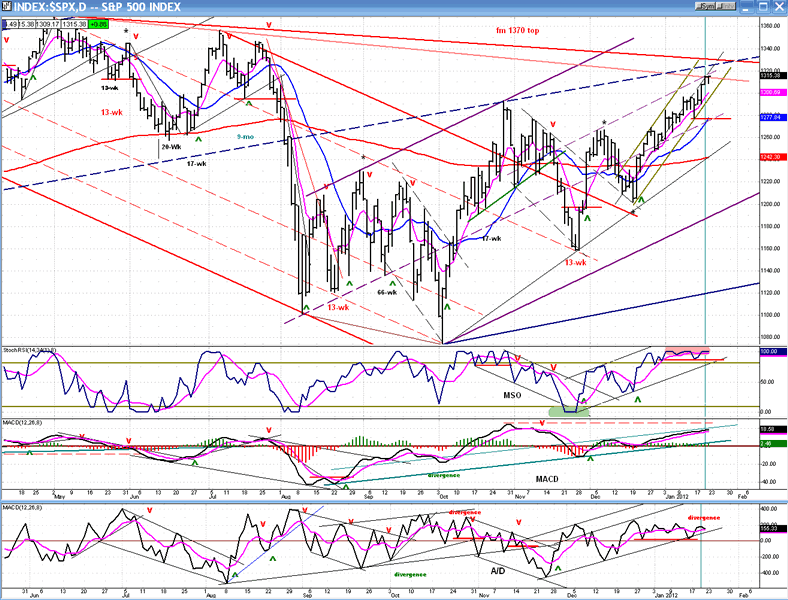
Others (of various length) are less important, but will nevertheless create a pool of resistance at this general level. This is reinforced by the P&F projection to about 1322.
In addition, if you look at the indicators, there is no question that we are getting close to a correction. The MSO has now been overbought for over four weeks, while the A/D indicator is showing increasing negative divergence and appears ready to break out of its up-channel.
The MSO is reflecting the index strength, but the MACD is not that bullish. Although it has overcome its nearest short-term top, it is still trading below its early November high while the price has exceeded it by over twenty points.
As far as the price is concerned, it is now contained in the lower half of a short-term channel, and is no longer rising to the top channel line - a sign of deceleration.
As we always do, we follow the daily chart with the Hourly Chart to see how the trend stands up to scrutiny under the microscope. In this case, the price trend is still up, but look at the indicators. It may have been a little premature to assign negative divergence to all of them before we see how the index performs on Monday, but I do have a target in mind: 1322, which is only 7 points away. When that target is reached - assuming that we have a positive opening on Monday -- I would not expect the SPX to remain at that level very long, but to begin to retrace almost right away. If I am wrong, the MSO is the one which would have the best chance of erasing its negative divergence. It would take a rise of 15 or 20 points in order for the other two to do the same. Based on what I see, I do not expect that to happen. Also, the next up-move should complete a 5-wave pattern from 1280.
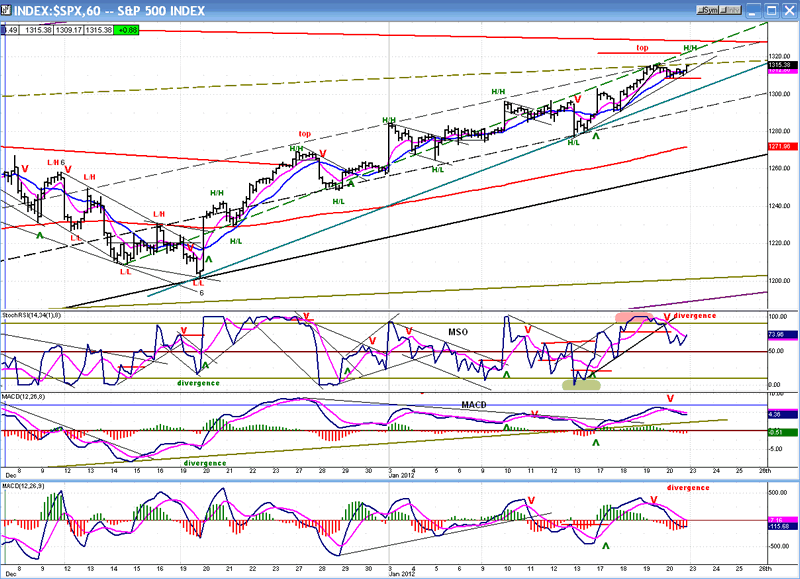
A short-term reversal at this level would not be an automatic sell. The SPX has been in a steady trend of higher highs and higher lows since it started this move on December 19. It would have to close below 1280 before a sell signal is confirmed. Subsequently, we would have to decide if this is only a temporary halt in the longer term uptrend, or if we have started a significant retracement. The activity of the next couple of weeks should give us an opportunity to make this evaluation.
Cycles
Next week is approximately six months from the July 2011 peaks and could bring about a high.
If we do have a reversal over the next few days, the downtrend could last until the first week in March when the next 15-wk cycle makes its low, along with two other important short-term cycles. (no change)
Breadth
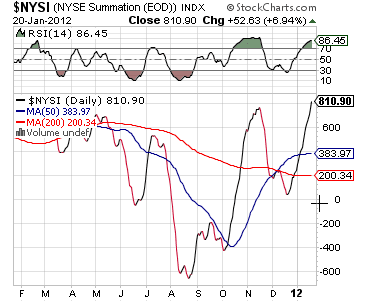
The Summation Index (courtesy StockCharts.com) has not only continued to rise, but it has slightly surpassed the former high. This could be an indication that the coming pause in the uptrend may not be the top of the bull market which started in 2009.
The RSI has reached the overbought area from which the index normally reverses (in conjunction with a reversal in equities). However, it is still rising, which suggests that a rounded top may be more likely to form as opposed to a sudden decline.
Sentiment
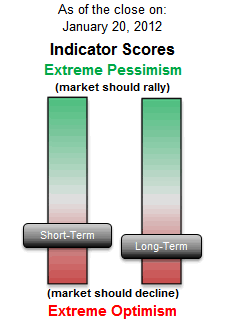
The SentimenTrader (courtesy of same) has reached a level of extreme optimism in its long-term indicator. This is normally associated with important tops, and should not be ignored. The SPX may not be one hundred percent ready to have a significant reversal, but this index is telling us that it is most likely already beyond the ninetieth percentile.
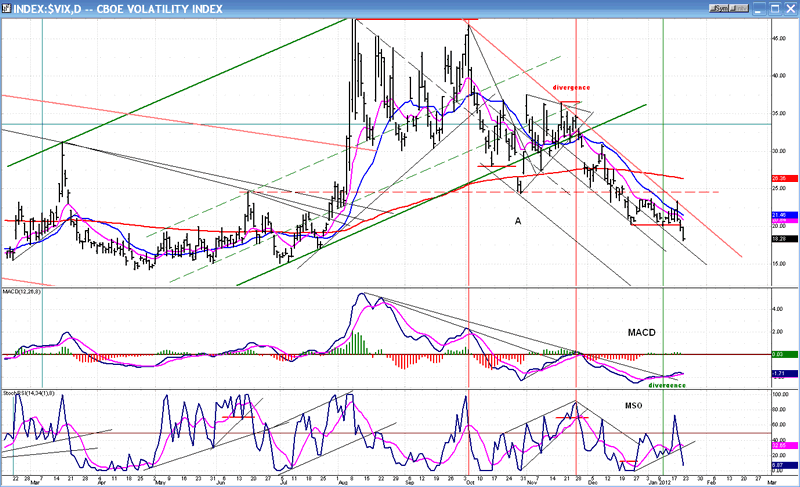
The VIX.
Last week, when I analyzed the VIX, there was one "little" detail that I failed to take into consideration: its intermediate downtrend line! That was a "big" omission, because that's what caused the analysis to go (temporarily) wrong. Note how the index did try to reverse, but it was stopped cold when it reached its downtrend line. So what now?
Note what happened at point "A" on the chart. The index found temporary support at about 25.50, but when it broke it, immediately found more support. Two days later, it was back above the broken level. Something similar may happen now.
If we have a market top early next week and reverse, there is a good chance that the VIX - which does the exact opposite of the SPX - will also reverse. Although the positive divergence was partially lost in the MSO, it was not in the MACD, and a quick reversal would preserve it.
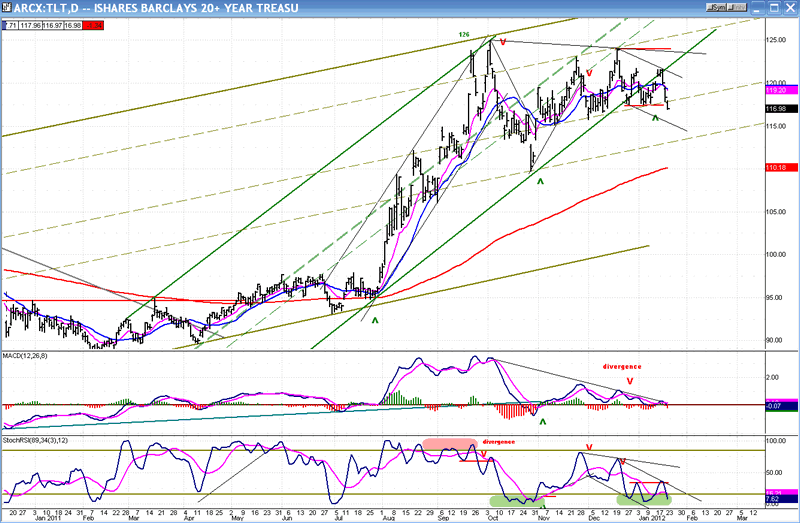
BONDS
The technical position of TLT is more complicated. The chart looks as if it is making an important top, but this is contradicted by the indicators which, although still in a downtrend, are in a position much more indicative of a low than a high. Taking this into consideration, as well as the fact that bonds have also been trending in the opposite direction of equity indices, we have to assume that TLT is probably making a re-accumulation pattern which is not yet complete.
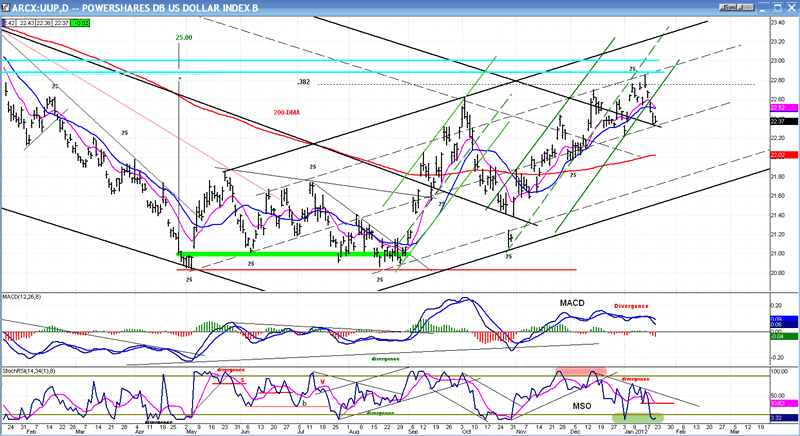
UUP (Dollar ETF)
When analyzing an index, we should first determine the status of the longer term trend. In the case of UUP, it is currently undergoing a consolidation in an intermediate trend which started after an important base (identified by wide green line) was formed. On the P&F chart, this base carries a potential projection to about 25.00 (90 on the US dollar). Since the index has broken out of its base, successfully retested the low, and made a higher high, we can assume that the intermediate trend is intact and that the move will eventually carry to the price level indicated by the projection.
Five days ago, UUP made a new high, but it also met with resistance at an internal trend line which had stopped rallies on several previous occasions. Although the indicators initially followed the price action, they quickly gave up and reversed, causing some negative divergence and warning that the index needed to do more work before it could continue its uptrend.
The price has now back-tested the top channel line which had been broken earlier. At that level, it also has support from the median of the channel. Whether it holds here or extends its correction lower is not important, unless it demonstrates the intention of challenging its intermediate uptrend. With the MSO already oversold and beginning to turn up, this looks like an incomplete consolidation in an uptrend. In fact, there is a certain resemblance between the pattern that it is making and that of TLT.
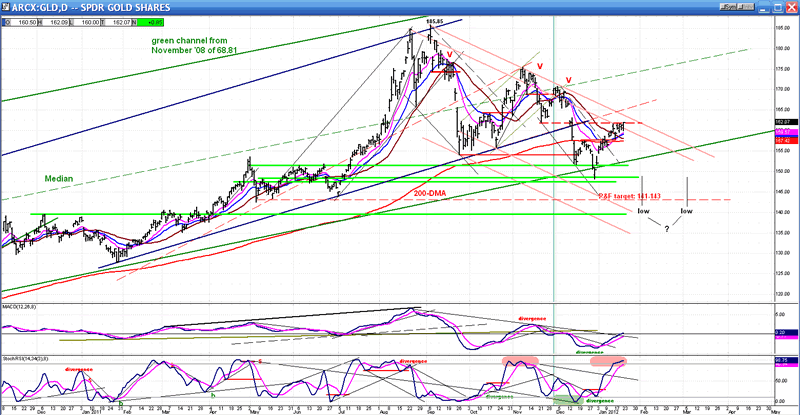
GLD (ETF for gold)
Last week, I pointed out the technical factors affecting the index, both over the short and intermediate trend. This week, I will simply discuss the action of GLD for the past week, and how it has affected its technical position. If you wish to review what was said last week, you can find my newsletter in the archives of Safe Haven.
I believe that GLD is currently making an intermediate correction and that the bounce it is experiencing (the result of a bottoming cycle) is either a consolidation in a downtrend with lower prices to come (141-143 would fill a P&F projection), or that it has started a basing pattern which requires much more work -- including a test of the low. Before resuming its uptrend, it would have to break its intermediate downtrend line.
The index has reached a resistance level and filled the near-term target of 162-163. With the MSO now overbought, it could soon be in position to reverse its short-term trend.
Summary
The SPX is signaling that it is ready for a short-term reversal. It may also be in the process of forming a more important top. A little more time is required to evaluate this possibility.
FREE TRIAL SUBSCRIPTON
If precision in market timing for all time frames is something which is important to you, you should consider a trial subscription to my service. It is free, and you will have four weeks to evaluate its worth.
For a FREE 4-week trial. Send an email to: ajg@cybertrails.com
For further subscription options, payment plans, and for important general information, I encourage you to visit my website at www.marketurningpoints.com. It contains summaries of my background, my investment and trading strategies and my unique method of intra-day communication with Market Turning Points subscribers.
By Andre Gratian
MarketTurningPoints.com
A market advisory service should be evaluated on the basis of its forecasting accuracy and cost. At $25.00 per month, this service is probably the best all-around value. Two areas of analysis that are unmatched anywhere else -- cycles (from 2.5-wk to 18-years and longer) and accurate, coordinated Point & Figure and Fibonacci projections -- are combined with other methodologies to bring you weekly reports and frequent daily updates.
“By the Law of Periodical Repetition, everything which has happened once must happen again, and again, and again -- and not capriciously, but at regular periods, and each thing in its own period, not another’s, and each obeying its own law … The same Nature which delights in periodical repetition in the sky is the Nature which orders the affairs of the earth. Let us not underrate the value of that hint.” -- Mark Twain
You may also want to visit the Market Turning Points website to familiarize yourself with my philosophy and strategy.www.marketurningpoints.com
Disclaimer - The above comments about the financial markets are based purely on what I consider to be sound technical analysis principles uncompromised by fundamental considerations. They represent my own opinion and are not meant to be construed as trading or investment advice, but are offered as an analytical point of view which might be of interest to those who follow stock market cycles and technical analysis.
Andre Gratian Archive |
© 2005-2022 http://www.MarketOracle.co.uk - The Market Oracle is a FREE Daily Financial Markets Analysis & Forecasting online publication.