


Arbitraging Fed Policies With U.S. Rental Housing Market Cash Flows
Housing-Market / US Housing Feb 14, 2012 - 12:48 PM GMTBy: Dan_Amerman

 By forcing interest rates to record low levels, the Federal Reserve has effectively vaporized most interest income along with most of the ability to benefit from compound interest, with devastating results for many retirees, retirement investors and pension funds.
However, in the process of creating artificially low interest rates for an entire economy, the Fed has also opened up unusually profitable opportunities for individual investors with certain types of investments. Record-low interest rate levels are the most powerful of six different factors that are currently working together to increase owner cash flows from the purchase (or refinancing) of investment real estate in the United States.
In combination, these six factors have created the best fundamentals for cash flow-driven real estate investments in the modern era, delivering not only historically high cash flow in an otherwise yield-starved world - but also substantially higher safety margins than normal.
In some important ways, long term cash flow investing is almost the diametric opposite of short term price appreciation investing. As the last decade's real estate bubble was creating a short lived golden era for speculators, it also nearly ruined the market for the cash flow investors. Real estate prices rose so high in some major metropolitan areas that there was simply no way to take out a substantial mortgage to buy a property and then rent it out at a positive cash flow.
The cash flow investors are currently getting their "revenge", however, for in the aftermath of the housing bubble - we can now find the best fundamentals for cash flow-oriented investment in our lifetimes. This article will place these key fundamentals in a 20 year context, and then look at how artificially low interest rates - along with five other factors - are working together right now in the market to boost cash flow opportunities.
Understanding Cash Flow Investing
The most important feature of real estate cash flow investing is that it exists on the margin: you get what cash is left over after the expenses have been paid.
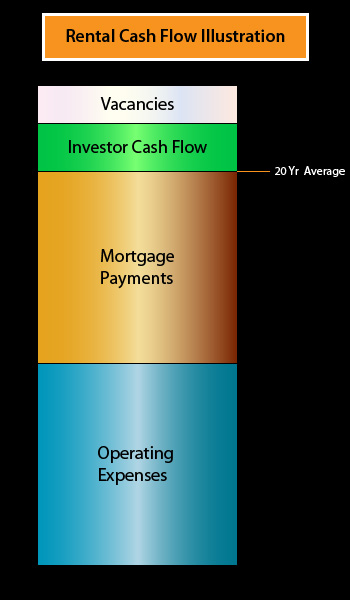
The column above represents the gross rental cash flow from a generic property.
First, we subtract for assumed vacancy rates, since we never collect the rent when a unit is empty.
Next, we pay the operating expense bills. This includes basic maintenance, some utilities, property taxes, insurance, leasing expenses, a professional property manager in the example proportion above, other expenses, and a reserve for capital replacement (i.e. setting aside for that new roof that will be needed within the next several years).
We also have to pay principal and interest on the mortgage - with interest being by far the largest component of our mortgage payment in the early years.
What's left afterwards is ours. We earn our profits on the margin, after these substantial expenses have been paid.
There has of course been enormous variation over the years in how large our cash flow is expected to be, and how it compares to our initial equity investment. Real estate is always not only local, but property-specific. However, the proportion shown is the minimum for what a lender is going to want to see for their coverage ratios, so either the initial cash flow coverage is in at least the range shown, or there is no financing and thus no deal (with many types of financing).
A 20 Year History Of Financing Costs
The cost of mortgage payments is often the number one factor that determines cash flow returns and feasibility. This is because the mortgage cost is such an important part of cash flow, and also because interest rates and property prices tend to bounce up and down much more dramatically than do the other components.
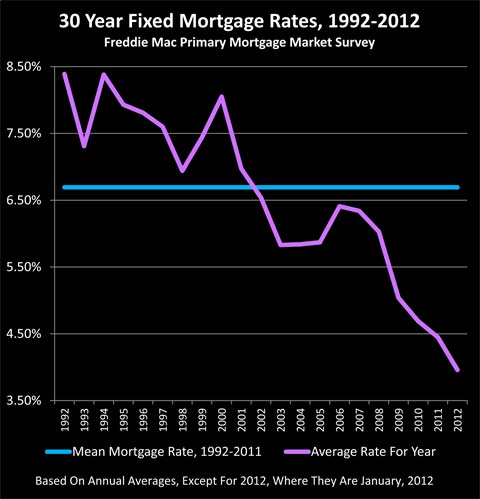
The above is a history of mortgage rates over the last 20 years. Perhaps the most noteworthy feature is the plunge in interest rate levels in recent years - meaning interest costs as a percentage of cash flows have never been lower. The level to which the Federal Reserve has forced interest rates in general - and mortgage rates in particular - is without precedent in modern times.
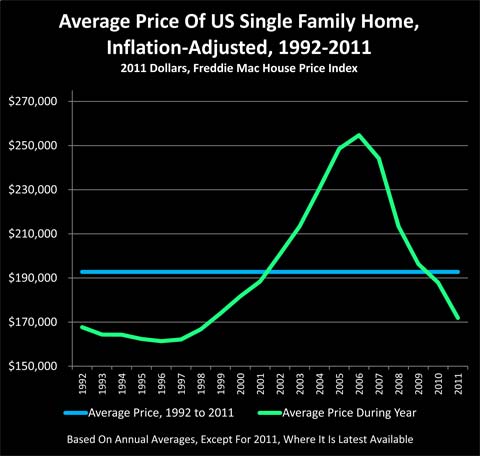
The above graph shows average single family home prices in the US over the last 20 years, as reported by Freddie Mac, and is adjusted for inflation (CPI-U). The two most striking features are the surge in prices that was the real estate bubble - and the plunge in prices since that time.
From the perspective of price speculators, short term fluctuations in real estate prices are everything. Prices still matter for long term cash flow investors, but inflation over time will usually bail them out anyway, so picking just the right purchase and sale dates are not nearly as important. What does determine returns and safety margins is revenues versus expenses, and that means the size of the mortgage payment can be paramount.
When we combine interest rates and inflation-adjusted housing prices we get the next graph, which is inflation-adjusted mortgage payments. This is what matters most for a cash flow investor, and when we combine the plunge in property prices with the plunge in interest rates, we see something rather remarkable.
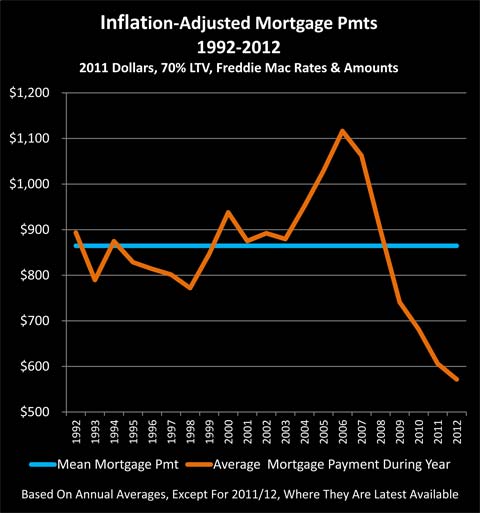
The real estate peak is still there, but it is no longer the most prominent feature on the graph. Instead, it is the extraordinary, historically unprecedented plunge in inflation-adjusted mortgage payments. Indeed, when we combine prices and fixed interest rates - it has never been cheaper to finance a property in the modern era.
(Please note that the preceding graph is about proportions and relative levels, rather than literal average mortgage payments on rental properties. Accessing accurate rental price data on a national basis is problematic as the available few sources are heavily focused on apartments in major metropolitan areas, or have other methodology issues.
Herein, single family homes are used as a proxy in order to get a truly national picture for relative changes in mortgage payments. However, the mortgage payments on an individual rental unit can often be less than half as much as a "normal single family home in the suburbs", sometimes much less. There is enormous variation by state and metro area, location within the area, unit size and amenities. Investment is assumed in a 1-4 unit structure (or larger property conforming to Freddie or Fannie multifamily standards) allowing access to 30 year fixed rate mortgages.)
Since cash flow real estate investing is always on the margin, let's take a look at what happened at the peak - and compare to the very different conditions today.
Real Estate Bubble & Cash Flow Investing
The following graph takes a look at investment conditions at the peak of the real estate bubble in 2006. Property prices were skyrocketing around the nation, and in a number of metropolitan areas prices had reached the economically irrational point where the average worker couldn't even come close to affording the average home, not without a short term teaser rate and/or a whopping down payment that came from the sale of their previous home.
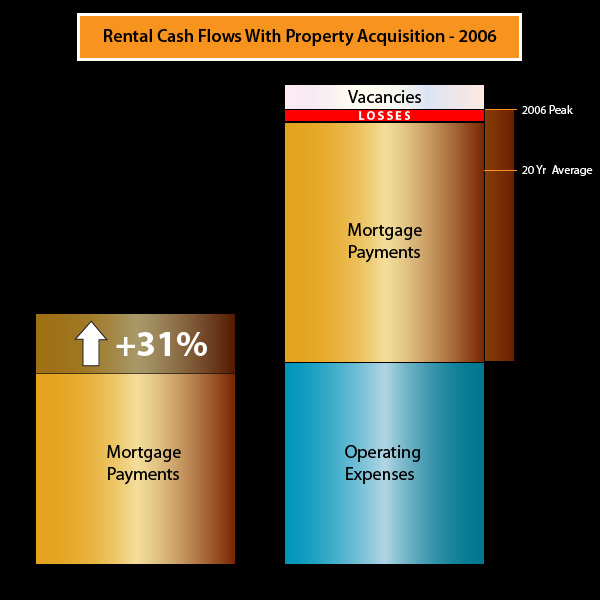
Even though interest rates were quite low on a historical basis (which is part of what created the bubble), the rapid spike in housing prices created a spike in mortgage payments for those acquiring rental properties. However, even while housing prices swiftly grew ever more economically irrational - rents by and large remained rational, as there were no subprime teaser rate financings for renters. Instead they had to come up with the cash every month, which meant they needed the real income.
When it came to mortgage expenses, as shown on the left side of the illustration, those investors using fixed rate financings saw their costs rise by a national average of 31% per unit.
But the rents didn't even come close to keeping up. So as we can see on the right side of the illustration, the increase in mortgage payments consumed 100% of investor cash flow and more, turning cash flows negative.
The irrational surge in property prices entirely consumed the margins, forcing cash flow investors from the markets, even while real estate "investment" in the mind of the public became synonymous with price appreciation speculation. This destruction of the rational basis for real estate investment (in some markets) was one of the many "canaries in a coal mine" that were singing away at full volume by 2006.
Cash Flow Investing In The Current Market
The one-two combination of falling interest rates and falling property prices has slashed the cost of mortgage payments today, with a total inflation-adjusted reduction of 49% over a five year period. As we can see in the left side of the illustration below, this not only reduced financing costs below the 20 year average, but kept on going down to a record low.
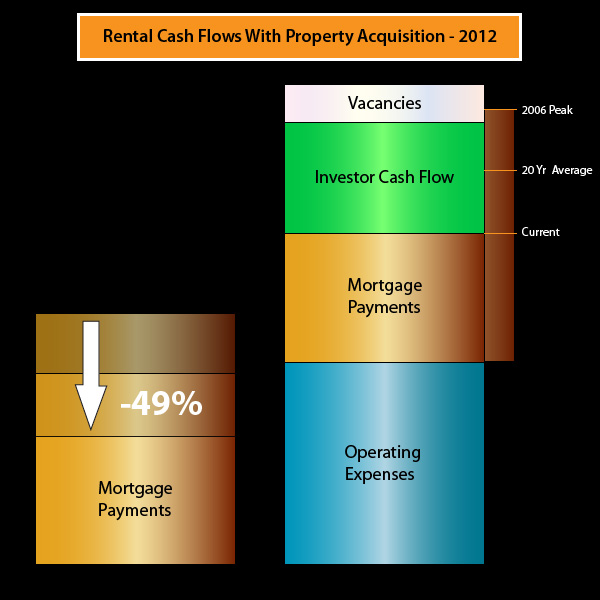
However, rents have not gone down, indeed they are rising around the nation.
Since cash flow real estate investment is done at the margin, this means that the benefits of the plunge in financing costs are going straight into the pockets of cash flow investors. The amount of cash left over after expenses has more than doubled. And the sheer size of that fat green bar of available owner cash flow is unprecedented.
In these yield-starved times, that should be of keen interest to many investors, but what is of even greater interest is that the increase in yield is accompanied by an increase in safety - which is the direct opposite of how return and risk work with most investments.
Many people think in simple asset price terms, and with most investments that are based on price - the higher that prices soar, the more the asset is moving away from its long term average value, and the greater the eventual crash, whether we are talking about real estate, tech stocks or tulip bulbs. The better that things look, and the more enthusiastic the investors - the more likely there will eventually be an unfortunate ending.
When long-term, fixed rate mortgages are used, the cost of financing can be locked in at purchase or in a refinancing. This locks in the spread with rental income, so long as rents do not drastically deteriorate. Rents and operating expenses each rise with inflation, while the mortgage payments do not, and that fat green bar at the margin gets a little larger each year.
Locking In Safety Margins
As an illustration, let's say that with a given amount of debt (loan to value), and an average property purchased with an average mortgage (over the last 20 years), that with expected rents and vacancies, we expected at closing to have $1.20 in cash flow for every $1.00 in expenses, so we expected a 20% coverage margin, or safety margin.
In 2006 - it was 95 cents in cash coming in for every dollar going out in expenses, so we may have sat out investing in some metro areas for a while.
Now, because of the Federal Reserve's massive and unprecedented actions in forcing interest rates far below free market levels, inflation-adjusted mortgage payments have plunged and thereby dramatically dropped our entire cost structure - but rents have not plunged - so we expect to have $1.45 in cash flow for every $1.00 in expenses. We have a 45% coverage margin.
We lock what is very unusual about the expense structure today - an interest rate distortion that would not exist except within the extraordinary ongoing financial crisis - and we lock it in when we close on the property and mortgage. The 45% safety margin is there from that day forward.
Between national, area and property-specific fluctuations in vacancies, rents and operating expenses, history is full of real estate investments burning through anticipated 20% safety margins and going cash flow negative. As with any investment offering potentially lucrative returns, there are always risks. However, the combination of negative events hitting at the same time to burn through a 45% safety margin on a sustained basis is statistically far less likely than the probability of the combination of negative events needed to burn through a 20% safety margin. So the increase in safety margin is actually likely a good bit greater than the simple comparison of 45%/20% might look at first glance.
In the theoretical world of academic finance, one is most emphatically not supposed to be able to do this. The free market is supposed to prevent this, an investor should not be able to double returns while doubling safety margins. We should most particularly not be able to do this in a yield-starved environment.
But this opportunity does exist specifically because there is no free market in interest rates. This is one of the ways to arbitrage a government that is cheating its own savers and retirees out of the interest rates they would get in a free market. Which means it is also the essence of self-defense against irresponsible government actions.
Supply, Demand, Rents & Vacancies
The unprecedented low cost of mortgage payments in inflation-adjusted terms is not the only rental market factor moving to increase the amount of money available on the margin to investors. There are four other key factors that affect the margin - and all four are currently moving in the favor of cash flow real estate investors.
R. Amerman, CFA
Website: http://danielamerman.com/
E-mail: mail@the-great-retirement-experiment.com
Daniel R. Amerman, Chartered Financial Analyst with MBA and BSBA degrees in finance, is a former investment banker who developed sophisticated new financial products for institutional investors (in the 1980s), and was the author of McGraw-Hill's lead reference book on mortgage derivatives in the mid-1990s. An outspoken critic of the conventional wisdom about long-term investing and retirement planning, Mr. Amerman has spent more than a decade creating a radically different set of individual investor solutions designed to prosper in an environment of economic turmoil, broken government promises, repressive government taxation and collapsing conventional retirement portfolios
© 2012 Copyright Dan Amerman - All Rights Reserved
Disclaimer: This article contains the ideas and opinions of the author. It is a conceptual exploration of financial and general economic principles. As with any financial discussion of the future, there cannot be any absolute certainty. What this article does not contain is specific investment, legal, tax or any other form of professional advice. If specific advice is needed, it should be sought from an appropriate professional. Any liability, responsibility or warranty for the results of the application of principles contained in the article, website, readings, videos, DVDs, books and related materials, either directly or indirectly, are expressly disclaimed by the author.
© 2005-2022 http://www.MarketOracle.co.uk - The Market Oracle is a FREE Daily Financial Markets Analysis & Forecasting online publication.