Stocks Bear Market - Dow Theory Proves Correct!
Stock-Markets / Dow Theory Jan 12, 2008 - 02:45 PM GMTBy: Tim_Wood

 In spite of its criticisms, the Dow theory is once again proving correct. The one thing that the advance up out of the 2002 low has proven is that the single most important aspect of Dow theory is the concept of joint price confirmation above and below previous secondary high and low points. Basically, nothing else matters. In accordance with this basic concept, the primary trend first turned bullish on June 4, 2003. As the market advanced in the wake of mountains of liquidity the values did not make sense. Also, when looking at the phasing aspect of Dow theory it appeared that the rally out of the 2002 low was a giant secondary reaction and counter-trend advance.
Understand that cycles have absolutely nothing to do with Dow theory, but from a cyclical perspective we have also been operating in an extremely stretched 4-year cycle. It's now so stretched that we are operating within the second longest cycle in stock market history. The statistics have been and continue to be very much against the market. Yet, the market chugged higher and higher stretching the cycle and the statistics even further. In the process, this move has indeed proven that the value and phasing aspects of Dow theory are subordinate to the basic concept of primary trend confirmation. From a Dow theory perspective, nothing else has mattered and as reported here, the first and only bearish primary trend change since the 2002 low occurred on November 21, 2007.
At that time the market was moving into a low and the bounce that followed caused many to question the integrity of the primary trend change. But, from both a cyclical and a Dow theory perspective, I told subscribers that the expected bounce up out of the November low was a counter-trend move. The Cycle Turn Indicator signaled that top beautifully and on January 8, 2008 the Industrials closed below their November low, as did the Transports. This joint break and new closing low served to reconfirm the controversial primary trend change that occurred on November 21, 2007. So, in spite of the controversy, the January 8 th close proved once again that the most important aspect of Dow theory is the very basic concept of primary trend confirmation and that the November 21 st bearish trend change is definitely still intact. The current Dow theory chart can be seen below .
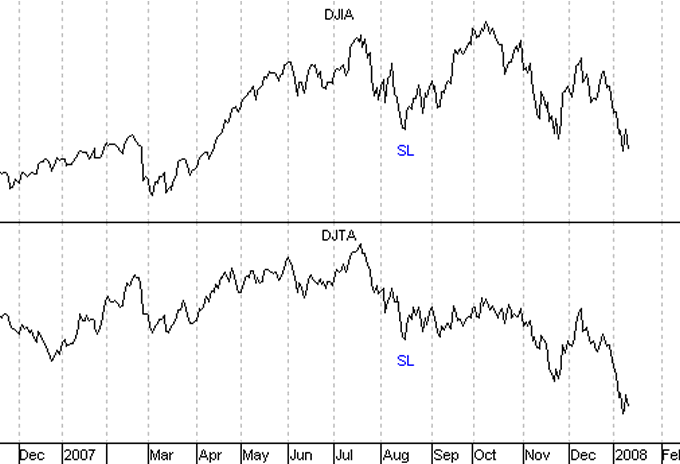
As we move into the window for the next turn point, the rally that follows will once again cause raise question in regard to the authenticity of this primary bear market. But, to date we have not seen any evidence to suggest that this bearish trend has ended. In fact, all of the statistics are just now coming into play. There will be rallies along the way and some will be fast and furious. But, until the now bearish primary trend change is reversed in accordance with Dow theory principle, any bounce will continue to be viewed as a secondary reaction.
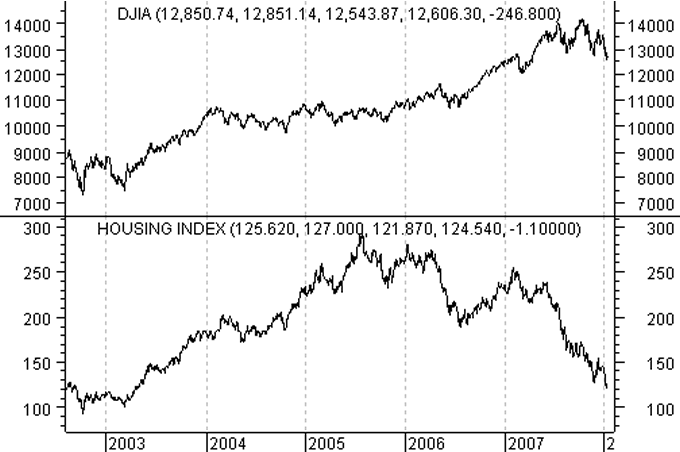
Now I want to review the progress of the list of important indexes that have lead in association with this primary bearish trend change. First we have the Housing Index, which I first warned about topping here back in October 2005. In looking at the current chart below you can see that this index has recently made new lows along with the Industrials just this past week. In fact, this index is now back at its 2003 levels.
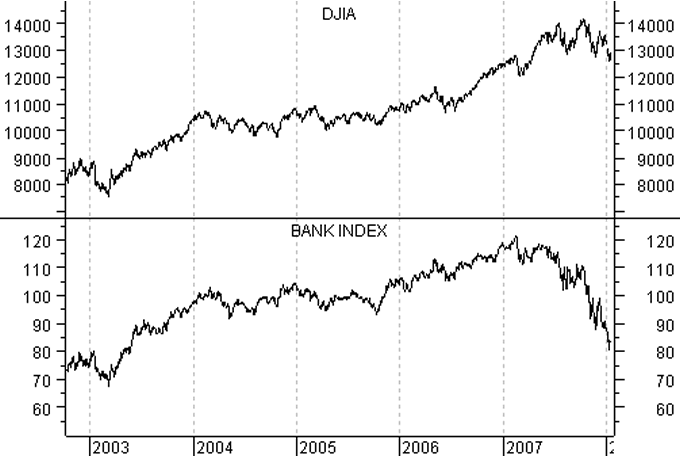
Following the Housing Index we next saw the Banking Index peak in February 2007. As you can see in the chart below, here too, this index also moved to new lows this past week in conjunction with the additional weakness seen by the Industrials. I can also report to you that the Banking Index is now back to its 2003 levels as well.
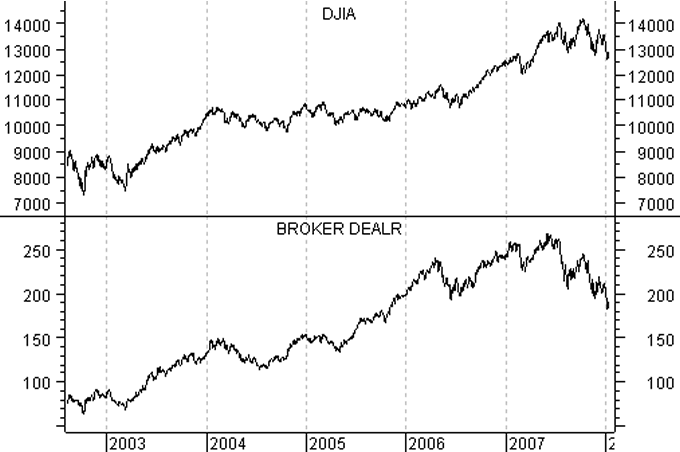
The top in the Broker Dealer Index then followed in June 2007 and this chart can be found below. Again, the weakness seen by the Industrials this past week was also further confirmed by the Broker Dealers and this index is now sitting at 2005 levels.
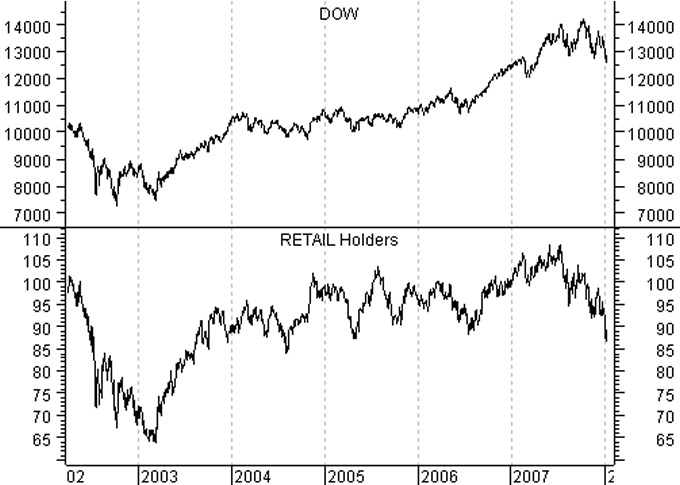
Next I have included a chart of the Retail Holders Index, which topped out in July 2007. Here too, the weakness seen by the Industrials this past week was also confirmed by the Retailers, which now sits at 2003/2004 levels as well.
But wait, what about tech? Well, next you will find a chart of the Industrials verses the Semiconductors. No one seems to be talking about it, but even this sector is now back to its 2003 and 2004 levels.
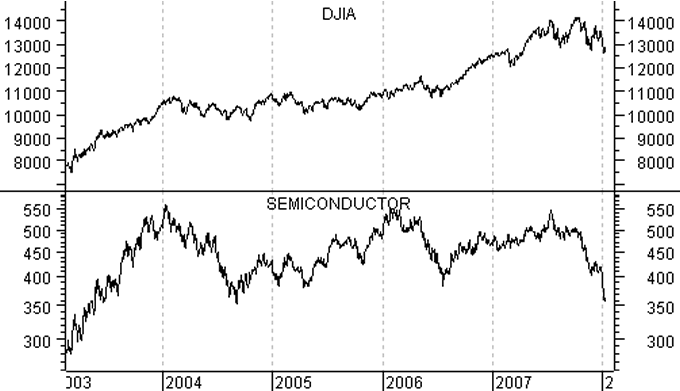
So, my point here is that the big blue chips were the last to peak this time around as this cycle and the historical norms continued to be stretched. As a result, of this stretching the public has been lulled to sleep. They have bought the idea that the FED is in control, that Dow theory doesn't matter, that the cycles are meaningless, that this time is different and that the bull market will continue forever and ever amen. Well, I will admit one thing. This time has been different in regard to the degree this cyclical advance has run. But, the statistical norms that have been stretched and disregarded are once again becoming reality.
Let me add that the argument that the 2006 low marked the 4-year cycle low, is now backfiring on those that made this argument. Reason being, if the 2006 low was the last 4-year cycle low, then with most of these indexes now below those levels suggests that we will continue to see weakness into 2010. I say 2010 because based upon that alleged cyclical phasing the next 4-year cycle low would not be due in or around 2010. So, those who want to argue that the 2006 low marked the last 4-year cycle low now find themselves with a much more bearish scenario than they bargained for by originally making such claims.
Just as I have said all along, we have not seen a 4-year cycle low since the 2002 low. The statistics simply did not support any other argument. Fact is, we have been operating within a very very stretch 4-year cycle that has been held together with liquidity, bailing wire, duct tape, hope, hype and B.S. from the mainstream media. The Dow theory has proven correct and what is now the second longest 4-year cycle in stock market history is now only beginning to contract. You have been warned yet again!
I have begun doing free Friday market commentary that is available at www.cyclesman.com/Articles.htm so please begin joining me there. In the December issue of Cycles News & Views I reviewed all Primary Bear markets going back to 1896 in an effort to answer the question of how far this decline could potentially go. I also have a very detailed slide show presentation on cycle quantifications, which gives a statistical analysis surrounding the overdone 4-year cycle that I have been warning about as well. A subscription includes access to the monthly issues of Cycles News & Views, which included Dow theory, a very detailed statistical based analysis covering not only the stock market, but the dollar, bonds, gold, silver, oil and gasoline along with short-term updates 3 times a week.
By Tim Wood
Cyclesman.com
© 2007 Cycles News & Views; All Rights Reserved
Tim Wood specialises in Dow Theory and Cycles Analysis - Should you be interested in analysis that provides intermediate-term turn points utilizing the Cycle Turn Indicator as well as coverage on the Dow theory, other price quantification methods and all the statistical data surrounding the 4-year cycle, then please visit www.cyclesman.com for more details. A subscription includes access to the monthly issues of Cycles News & Views covering the stock market, the dollar, bonds and gold. I also cover other areas of interest at important turn points such as gasoline, oil, silver, the XAU and recently I have even covered corn. I also provide updates 3 times a week plus additional weekend updates on the Cycle Turn Indicator on most all areas of concern. I also give specific expectations for turn points of the short, intermediate and longer-term cycles based on historical quantification.
Tim Wood Archive |
© 2005-2022 http://www.MarketOracle.co.uk - The Market Oracle is a FREE Daily Financial Markets Analysis & Forecasting online publication.


