


Stock Market SPX Uptrend Extends
Stock-Markets / Stock Markets 2012 Mar 18, 2012 - 04:00 PM GMTBy: Tony_Caldaro

 A good performance by US and European markets as the US broke through resistance at SPX 1378 and rallied to 1406 on friday. For the week the SPX/DOW were +2.40%, and the NDX/NAX were +2.35%. Asian markets gained 0.8%, European markets gained 2.9%, and the DJ World index gained 1.9%. Economic indicators for the week were solidly to the upside. On the uptick: retail sales, business inventories, export prices, the NY and Philly FED, the CPI/PPI, capacity utilization, and the weekly jobless claims plus the WLEI improved. On the downtick: the budget deficit expanded, while import prices and consumer sentiment declined. Overall it was quite a positive week for stocks and the economy. Next week we get an update on the Housing market and Leading indicators.
LONG TERM: bull market
While our economic indicators remain below neutral, the economy continues to improve and the bull market continues to make new highs. Our weekly technical indicators are starting to hit extreme overbought levels, as the RSI is nearly 91 and the MACD is over 38. This kind of technical activity only occurs in bull markets.
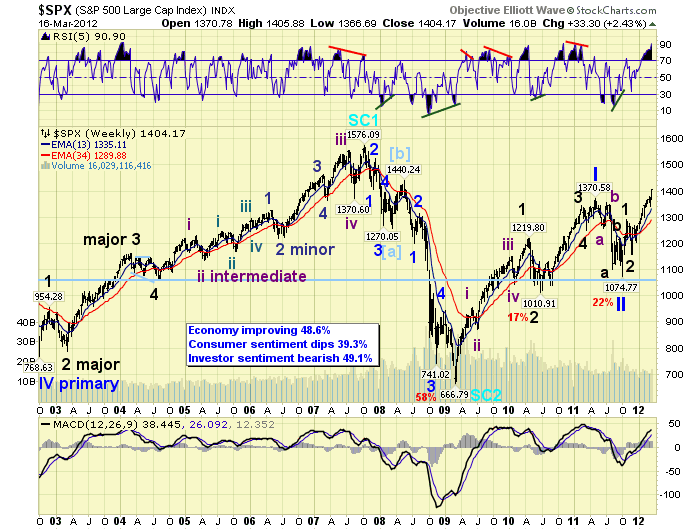
The count from the Mar09 SPX 667 low remains the same. This bull market is unfolding in five Primary waves to complete a Cycle wave [1] of the next Supercycle bull market. Primary waves I and II completed at SPX 1371 and 1075 respectively in 2011. Primary wave III is underway now. Within Primary wave I we had five Major waves with a detailed Major wave 1. Within Primary III we have most likely completed Major waves 1 and 2, and are in Major wave 3 now. Before this bull market ends, likely in 2013, we still need Major waves 4 and 5 to complete for Primary III, and then, Primary waves IV and V. It would appear this market has a long way to go, in wave structure, before completing it bull market. As for price, we continue to target the SPX 1545-1586 range by 2013.
MEDIUM TERM: uptrend high SPX 1406
Despite recent downtrend confirmations by 10 of the 20 international indices we track, the major US indices broke out to new highs this week carrying many international indices with them. Our latest tally now displays only 4 of the 20 international indices remain in confirmed downtrends. When this uptrend began in November at SPX 1159 we were expecting it to run into resistance between the OEW 1291-1313 pivot zone. It did, and took about one month to clear that area. Then we expected resistance between the OEW 1363-1386 resistance zone. Again the market stalled for about one month in this area, but broke out this week to move over SPX 1400. Now there is a large gap to the next resistance at the OEW 1440 pivot, and then another gap to the OEW 1499 pivot.
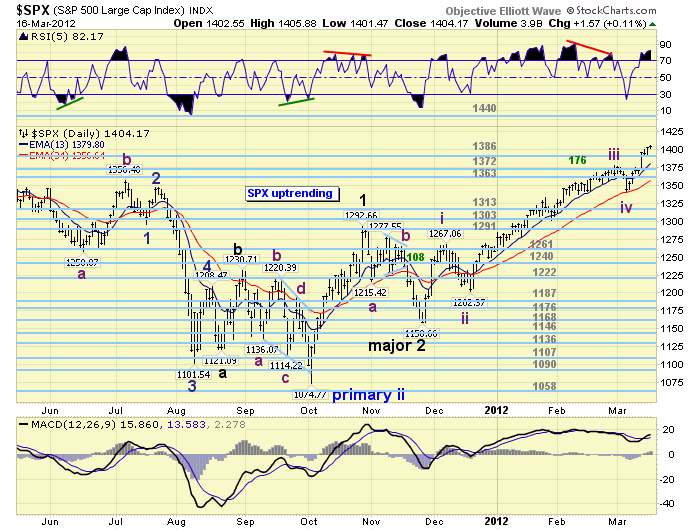
Also, at the beginning of this uptrend we expected a conservative three month rise and were labeling it as Intermediate wave one of Major wave 3. Now it appears, with the extension into its fourth month, and the rise above SPX 1400, this uptrend may be all of Major wave 3. We have been carrying this count, as an alternate, on the DOW charts. We have now decided to make Major wave 3 the preferred count, and the Intermediate wave one count the alternate. The counts on the SPX and DOW charts have been updated to reflect this change.
SHORT TERM
Short term support is at the 1386 and 1372 pivots, with overhead resistance at SPX 1407, then the 1440 pivot. Short term momentum is declining from a negative divergence. The short term OEW charts remain positive from SPX 1365 with support at the 1386 pivot.
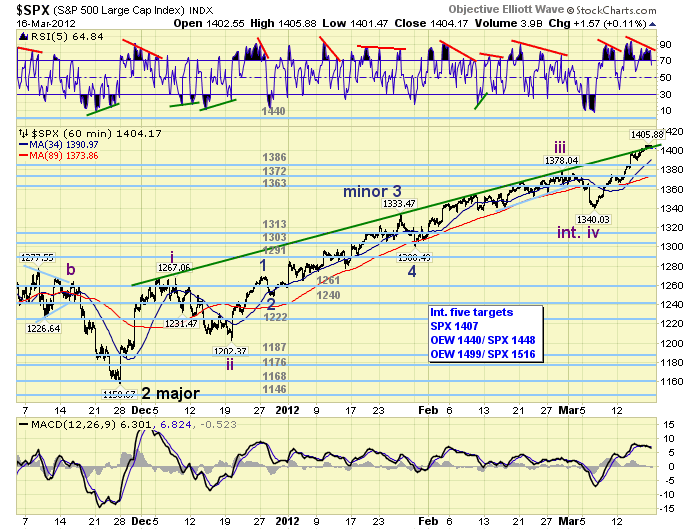
With the extension of the uptrend into its fourth month, and into the SPX 1400′s, we are likely dealing with a Major wave 3 uptrend now. The short term charts have been updated to reflect this change. The short term count is now as follows: Int. one SPX 1267, Int. two SPX 1202, Int. three SPX 1378, Int. four SPX 1340, and Int. five underway. Within Int. wave five we are currently counting the rally from SPX 1340 as Minor wave 1. The first level of fibonacci/pivot resistance is at SPX 1407: Int. v = 0.618 Int. 1. The next level is at the OEW 1440 pivot, and SPX 1448: Int. v = Int. i and 0.618 Int. iii. The last level is at the OEW 1499 pivot, and SPX 1516: Int. v = 1.618 Int. i and Int. iii. Since we are expecting this uptrend to continue into May the most obvious targets would be the OEW 1440 pivot, then the 1499 pivot. Best to your trading!
FOREIGN MARKETS
The Asian markets were mixed on the week for a net gain of 0.8%. Australia and India remain in downtrends.
The European markets were all higher on the week for a gain of 2.9%. Spain remains in a downtrend.
The Commodity equity group were mixed on the week for a net gain of 1.8%. Canada remains in a downtrend.
The DJ World index remains uptrending and gained 1.9%.
COMMODITIES
Bonds continued their downtrend losing 1.6% on the week.
Crude remains volatile, is still uptrending, and lost 0.3% on the week.
Gold remains in a downtrend losing 3.3% on the week.
The USD is uptrending, but lost 0.3% on the week. The EUR is downtrending, but gained 0.4%. The JPY remains in a downtrend losing 1.2% on the week.
NEXT WEEK
Housing is the primary focus of this weeks economic reports. On monday at 10:00 the NAHB sentiment will be released. On tuesday, Housing starts and Building permits. Wednesday we have Existing home sales. Then thursday weekly Jobless claims, the FHFA housing index, and Leading indicators. On friday, New home sales. The FED has a busy week. On monday at 9:30, FED director Killian testifies before congress on foreclosures and the housing market. On tuesday, FED chairman Bernanke starts his four part lecture on the financial crisis. On thursday, FED governor Tarullo testifies before the senate on regulatory reform, and FED chairman Bernanke gives his second lecture. Then on friday, FED chairman Bernanke gives a speech at the Wash. DC FED. Best to your week.
Stockcharts has made some significant changes to its public charts list. They require each member to resubmit their public charts list, with an initial limit of 100 charts. Since we currently have 228 charts posted, we will need to review the list and post what we feel are the only most important charts for now. Please bare with us as we make these changes. Sorry for the inconvenience. The new link is posted below.
CHARTS: http://stockcharts.com/public/1269446/tenpp
http://caldaroew.spaces.live.com
After about 40 years of investing in the markets one learns that the markets are constantly changing, not only in price, but in what drives the markets. In the 1960s, the Nifty Fifty were the leaders of the stock market. In the 1970s, stock selection using Technical Analysis was important, as the market stayed with a trading range for the entire decade. In the 1980s, the market finally broke out of it doldrums, as the DOW broke through 1100 in 1982, and launched the greatest bull market on record.
Sharing is an important aspect of a life. Over 100 people have joined our group, from all walks of life, covering twenty three countries across the globe. It's been the most fun I have ever had in the market. Sharing uncommon knowledge, with investors. In hope of aiding them in finding their financial independence.
Copyright © 2012 Tony Caldaro - All Rights Reserved Disclaimer: The above is a matter of opinion provided for general information purposes only and is not intended as investment advice. Information and analysis above are derived from sources and utilising methods believed to be reliable, but we cannot accept responsibility for any losses you may incur as a result of this analysis. Individuals should consult with their personal financial advisors.
© 2005-2022 http://www.MarketOracle.co.uk - The Market Oracle is a FREE Daily Financial Markets Analysis & Forecasting online publication.