


Gold's Continuing Vulnerability
Commodities / Gold and Silver 2012 Apr 23, 2012 - 02:32 AM GMTBy: Brian_Bloom

 The investment world is currently full of paradoxes. For example, whilst the Gold Bugs Index (the $HUI which is made up of more speculative counters in precious metals) has been deteriorating strongly – see chart 1, courtesy stockcharts.com – the ratio of the $HUI/$XAU shows that the $HUI has been rising since early 2011.
Chart 1
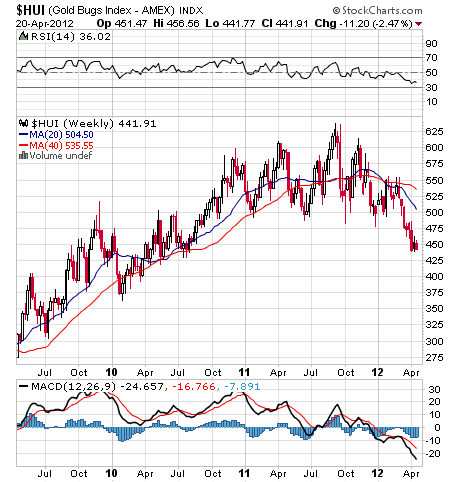
Chart 2
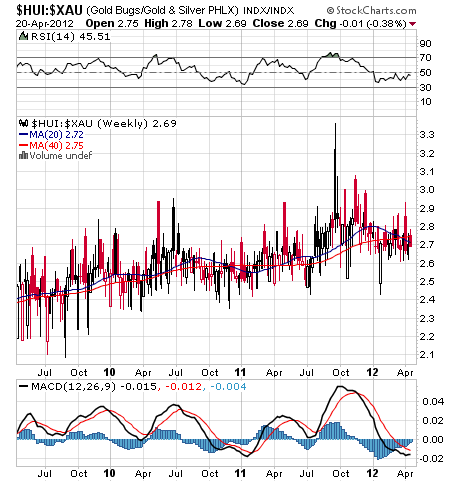
Furthermore, focussing on the MACD in Chart 2, the ratio looks like it is about to give a buy signal.
Chart 3 below is even more intriguing: It shows that the ratio of the $XAU/Gold Price is deeply oversold. Note how the RSI is at its lowest level in three years.
Chart 3
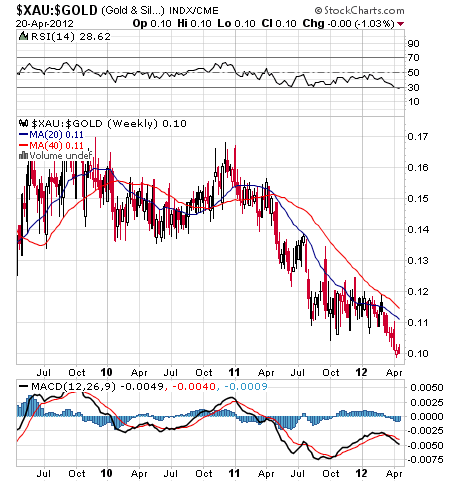
Note also the strong non-confirmation between the lower lows of the ratio and the higher lows of the MACD. Clearly, the rate of deterioration is slowing down – perhaps even drawing to a close.
Now, in context of a gold price that has broken below it 40 week MA – see Chart 4 below – does this mean that the gold price is about to bounce up following two clear sell signals? The two signals were:
1. The break of the price below its 40 week MA
2. The break of the 20 week MA below it 40 week MA
Chart 4
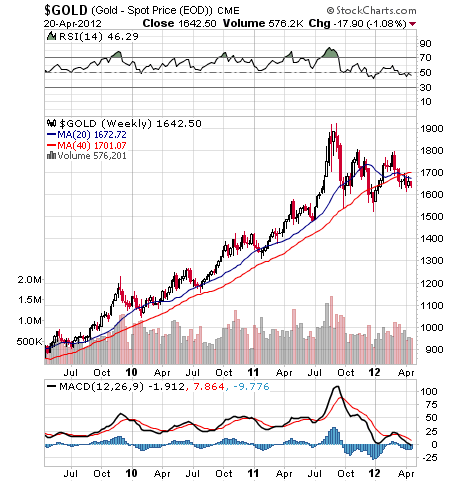
There are those who are arguing that the above chart is showing a reverse Head and Shoulders pattern and that the right hand shoulder is about to form as the gold price rises from its current level to the neckline at around $1800 an ounce – following which the price will break up and rise to over $2000. However, an analysis of volume patterns on the GLD chart does not validate the reverse H&S theory.
Further, if that were to happen – ie the gold price were to rise strongly – then the price of the shares (XAU and HUI) to gold will have to “scream” up – given that the ratios are oversold.
But therein lies another paradox. Chart 5 below shows the ratio of the $XAU divided by the $SPX: (Note that the scale of this chart is very insensitive. It has been adjusted to show three box reversals in moves of 5% at a time.)
Chart 5
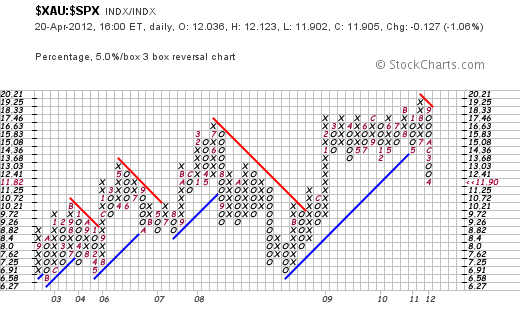
The fact is that, after trying seven times between 2009 and 2011 to rise to a new height relative to equities, gold shares finally gave up the ghost and have now entered a clear bear trend relative to equities.
So, either gold shares are going to rise strongly relative to a rising gold price – or the gold price is going to fall strongly relative to the gold shares that have been in a bear trend relative to gold since early 2011.
Conclusion
Given that markets look forward, the most logical conclusion is that the gold shares have been pointing the way. The reason that the ratio will rise is more likely related to static gold share prices or slowly falling gold share prices relative to a more quickly falling gold price.
Gold investors need to ask themselves the following question: “Why would the gold price rise after giving two sell signals on the weekly charts?”
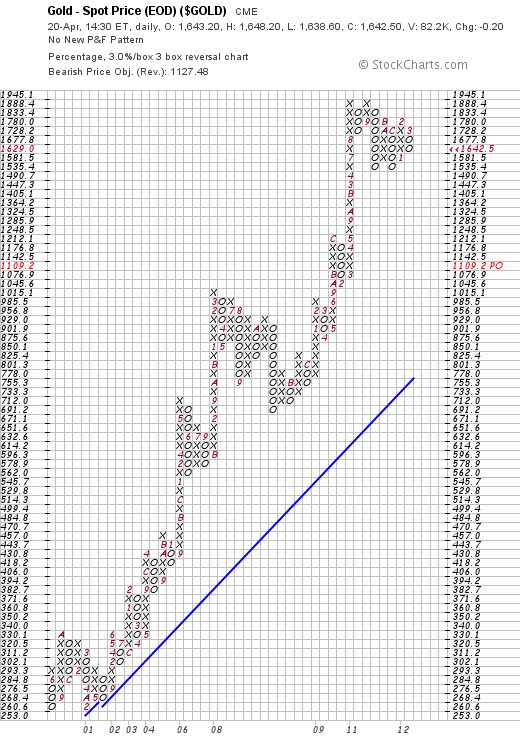
Chart 6 below – the 3% X 3 box reversal chart of the gold price – is pointing an “eventual” destination of $1109
Chart 6
Investors are cautioned on two counts:
1. There is no way of determining how long it will take for the $1109 target to be reached. It could be “years”, and the signal might even be reversed in the interim if the gold price rises above $1800 (low probability)
2. Even if the gold price does retrace to $1109, it will still be in a long term bull market.
Overall Conclusion
Long term investors should remain invested but should refrain from adding to their holdings at present price levels. Short term “traders” should assess whether they can weather foreseeable losses over an indeterminate time horizon.
Brian Bloom
Author, Beyond Neanderthal and The Last Finesse
In the global corridors of power, a group of faceless men is positioning to usurp control of one of the world’s primary energy resources. Climate change looms large. Can the world be finessed into embracing nuclear energy? Set in the beautiful but politically corrupt country of Myanmar, The Last Finesse, through its entertaining and easy-to-read storyline, examines the issues of climate change, nuclear energy, the rickety world economy and the general absence of ethical behaviour in today’s world. The Last Finesse is a “prequel” to Beyond Neanderthal, which takes a right-brain, visionary look at possible ways of addressing the same challenges. The Last Finesse takes a more “left brain” approach. It is being published in all e-book formats.
Copyright © 2012 Brian Bloom - All Rights Reserved
Disclaimer: The above is a matter of opinion provided for general information purposes only and is not intended as investment advice. Information and analysis above are derived from sources and utilising methods believed to be reliable, but we cannot accept responsibility for any losses you may incur as a result of this analysis. Individuals should consult with their personal financial advisors.
Brian Bloom Archive |
© 2005-2022 http://www.MarketOracle.co.uk - The Market Oracle is a FREE Daily Financial Markets Analysis & Forecasting online publication.