


Stock Market Breadth, VIX, And Trends Give Slight Edge To Bulls
Stock-Markets / Stock Markets 2012 Apr 27, 2012 - 02:17 PM GMTBy: Chris_Ciovacco

 On April 26, we mentioned the chart of the VIX “Fear Index” (VXX) relative to the S&P 500 (SPY) represented a good way to monitor risk in an environment with some conflicting signals. An updated version of the chart, as of Thursday’s close, is shown below. The bulls made some progress with the blue upward-sloping trendline being violated, which shows decreasing levels of fear relative to the willingness to take on risk (see red arrow).
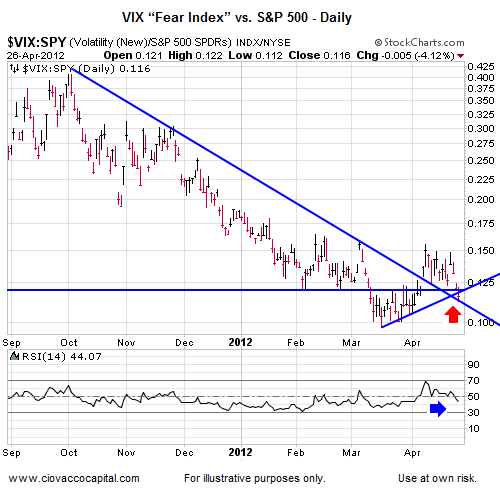
Obviously, Friday’s GDP report can flip the chart above one way or another, but another bullish signal was given on Thursday. Near the blue arrow above, notice that RSI (Relative Strength Index) made a lower low and closed below 50. The lower low represents a short-term bearish divergence for the VIX relative to the S&P 500 (bullish for risk). The divergence increases the odds of continued VIX weakness.
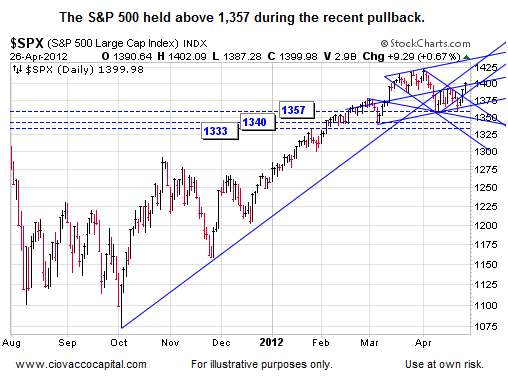
We originally posted the chart below on April 23. If you look closely, price moved to/slightly above the trendline below 1,400 on Thursday. There is some white space above the chart, which could be filled by price.
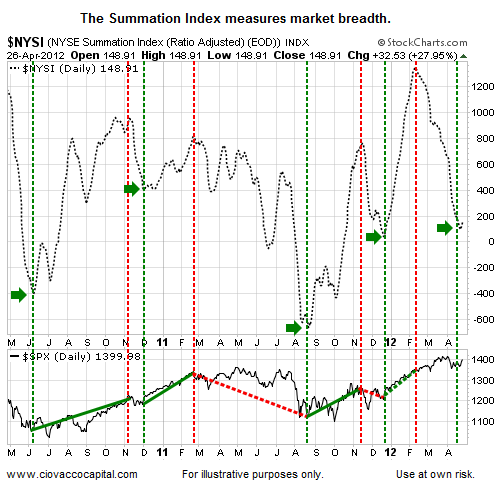
Just as the odds of rain increase when skies shift from clear to cloudy, a bullish turn in market breadth increases the odds of a sustainable bullish turn in stocks. Keep in mind, cloudy skies do not guarantee rain. The chart below is an intermediate-term measure of market breadth (the Summation Index). Market breadth refers to the percentage of stocks participating in an advance. Broad participation leans bullish. On Wednesday and Thursday, the Summation Index moved higher – it had been declining for several weeks. The green arrows show where market breadth started to improve. The S&P 500 is shown at the bottom of the chart.
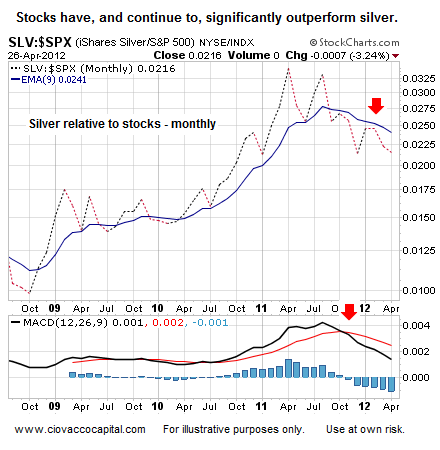
Commodities continue to lag stocks, which is not surprising in a deleveraging environment (a.k.a. debt reduction/less trading on margin). If you are a silver or gold bug, the chart below has yet to show much in the way of hope. The performance of silver (SLV) relative to the S&P 500 (SPY) has a bearish/downward-sloping 9-month exponential moving average (EMA) and a still ugly looking MACD, which measures momentum (see red arrows).
-
Copyright (C) 2012 Ciovacco Capital Management, LLC All Rights Reserved.
Chris Ciovacco is the Chief Investment Officer for Ciovacco Capital Management, LLC. More on the web at www.ciovaccocapital.com
Ciovacco Capital Management, LLC is an independent money management firm based in Atlanta, Georgia. As a registered investment advisor, CCM helps individual investors, large & small; achieve improved investment results via independent research and globally diversified investment portfolios. Since we are a fee-based firm, our only objective is to help you protect and grow your assets. Our long-term, theme-oriented, buy-and-hold approach allows for portfolio rebalancing from time to time to adjust to new opportunities or changing market conditions. When looking at money managers in Atlanta, take a hard look at CCM.
All material presented herein is believed to be reliable but we cannot attest to its accuracy. Investment recommendations may change and readers are urged to check with their investment counselors and tax advisors before making any investment decisions. Opinions expressed in these reports may change without prior notice. This memorandum is based on information available to the public. No representation is made that it is accurate or complete. This memorandum is not an offer to buy or sell or a solicitation of an offer to buy or sell the securities mentioned. The investments discussed or recommended in this report may be unsuitable for investors depending on their specific investment objectives and financial position. Past performance is not necessarily a guide to future performance. The price or value of the investments to which this report relates, either directly or indirectly, may fall or rise against the interest of investors. All prices and yields contained in this report are subject to change without notice. This information is based on hypothetical assumptions and is intended for illustrative purposes only. THERE ARE NO WARRANTIES, EXPRESSED OR IMPLIED, AS TO ACCURACY, COMPLETENESS, OR RESULTS OBTAINED FROM ANY INFORMATION CONTAINED IN THIS ARTICLE. PAST PERFORMANCE DOES NOT GUARANTEE FUTURE RESULTS.
Chris Ciovacco Archive |
© 2005-2022 http://www.MarketOracle.co.uk - The Market Oracle is a FREE Daily Financial Markets Analysis & Forecasting online publication.