


Q.E.3 IS COMING! Stock Market MAP Analysis Part 4
Stock-Markets / Stock Markets 2012 May 09, 2012 - 06:06 AM GMTBy: Marc_Horn

 In Parts 1 thru 3 we established that the principles of MAP Waves is nothing new and I claim no credit for it. It is actually the first step and foundation of all EW theory which rarely is referred to, and even more rarely used by many of the experts around us.
So let us revisit the basic basic EW practical lesson 1 - what lines to draw and what information we can derive from them to establish with probable potential pivots target areas which meet EW wave validation criteria.
I will only present 1 pivot scale (Dark Blue). RETROSPECTIVELY THIS IS EASY but hopefully we will end up with reasonable target areas at the end, with probabilities of possible outcomes so that it is possible to set trading and bail out parameters in order to control our PANIC behavior and do risk reward assessments!
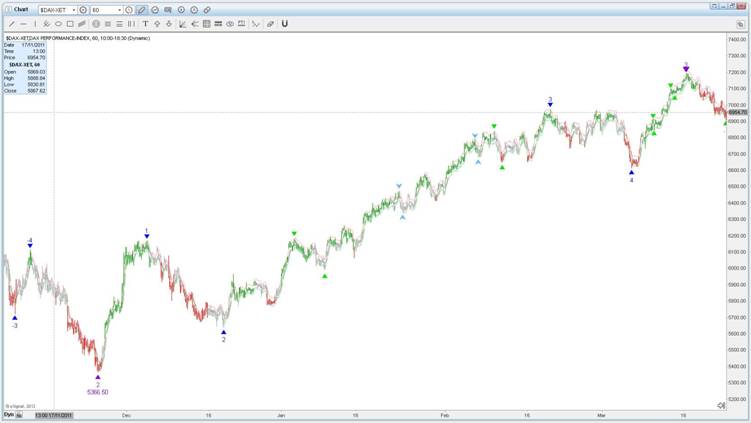
I colour code my pivot scales and lines to match to ease the interpretation of the picture when working on multiple time scales. Purple pivot 2 is also blue pivot -5. Purple Pivot 3 is also blue pivot 5.and in between you can see blue pivots 1 through 4. Those of you familiar with Elliot’s work will recognize these as extensions. Below I have numbered these pivots o the scales we will be looking at.
Draw line 1 between pivots -4 and -5. Draw lines 2 and 3 once pivot 1 is made as shown below.
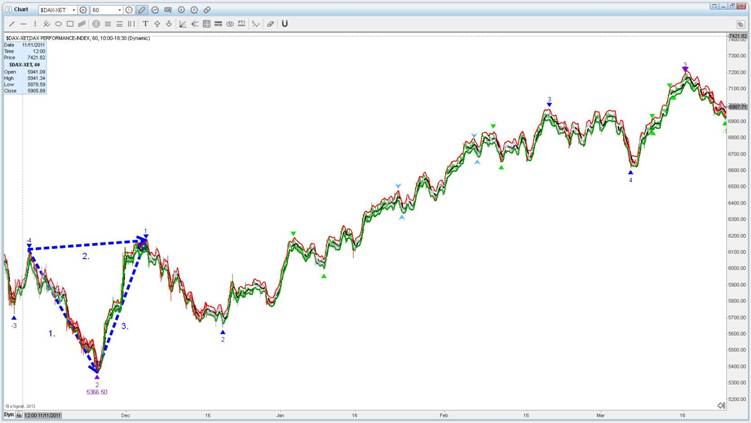
From these 3 lines we can now get target areas and limits as we have frequencies of blue waves in 2 directions! Our trading range so that we do not panic until below pivot 1and parallel 2. If prices move outside this area then there is a 80% probability we do not have a matching pivot scale and so we have established our emergency strategy – Bail Out parameters!
Draw the parallels as shown and they give you a wealth of information!
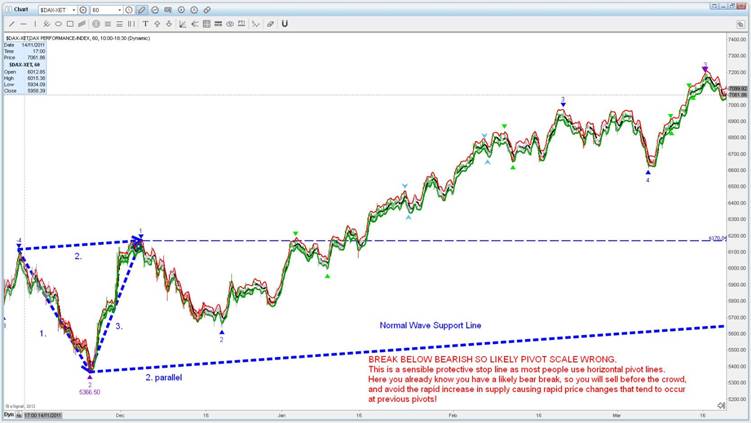
Parallel 1 gives us the normal wave target where it intersects parallel 2. It also is a support and resistance line, in this case very much a support line. If its support is pierced there is NO NEED TO PANIC – why – because your emergency strategy is set out above and it is trading with its expected range, which is now further reduced by parallel 3! A break outside parallel 3 means there is a 80% probability pivot 2 has been made and if we do not have a clear sub-pivot count should get us to re-evaluate our pivot selection up and down 1 scale due to the Law of Alteration! Once pivot 2 is confirmed we can modify our wave frequency by modifying parallels 1 and 2 by leaving their origin and making their second point our latest pivot – in this case blue 2 as shown below.
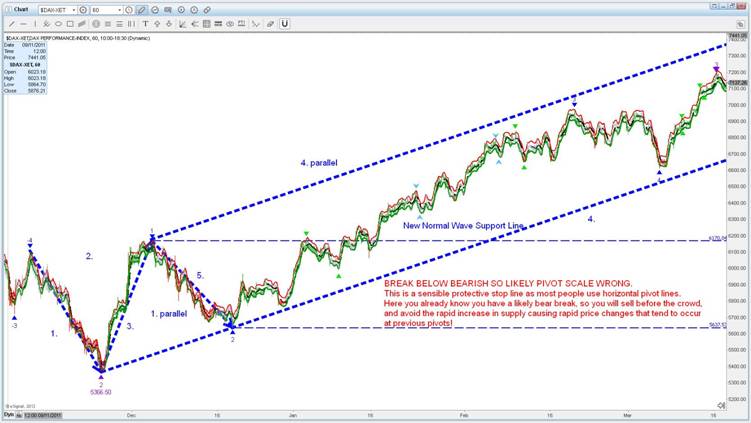
We now have a clearly defined trend channel in which prices can move without us panicing! We also know from MAP Analysis Parts 1 and 2 that there is a 50% chance of expecting an extension in wave 3. We also know from MAP Analysis Part 3 that depending on when waves of different frequencies interact that the law of alteration comes in as the waves can vary from 0.125 to 1.875 times their normal frequency. So for simplification let us just use 0 and 2 times.
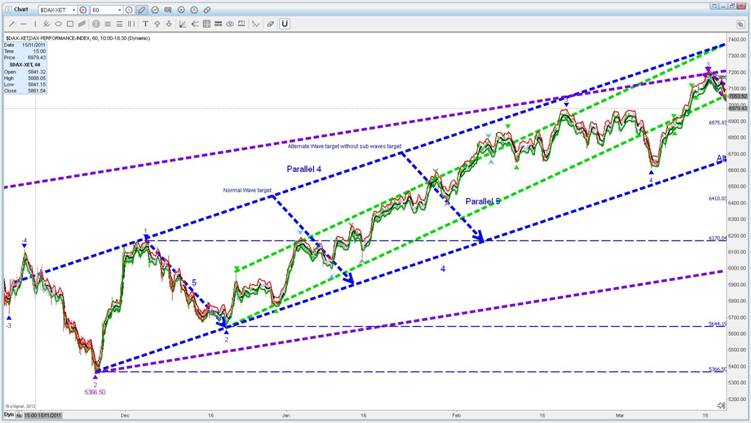
Our normal trading range is between support line 4 and parallel 4, as far up as we can ride this (assuming of course we went long at pivot 2. If you are conservative you may have waited for confirmation until pivot 1 was broken but the rules say greater than or equal so technically pivot 3 is on the table at any point from there on!!)
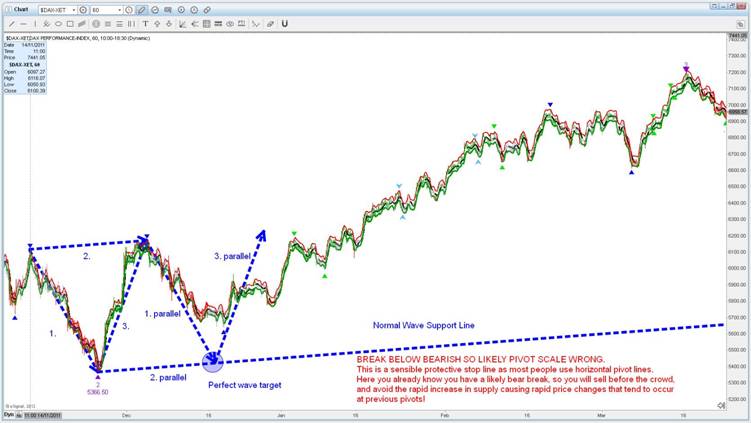
If we draw a parallel of 5, at once and twice its frequency as described above we get our normal wave and alternative wave target lines. In addition I have added a green support line which before prices reach parallel 5 very likely is sub pivot 2 as we are in a wave 3. This now is a support line for the first level subwave and is reducing our expected trading range for pivot 3 but as a subwave is in we can expect parallel 5 to be exceeded. We would expect further subwaves to trade within the green parallels and on a break of the green support line that pivot 3 is most likely in!
Once pivot 3 is in then we modify line again so pivot 1 to 3 and its parallel to 2 and parallel 5 to pivot 3 as shown below to give us our pivot 4 target and trading limits!
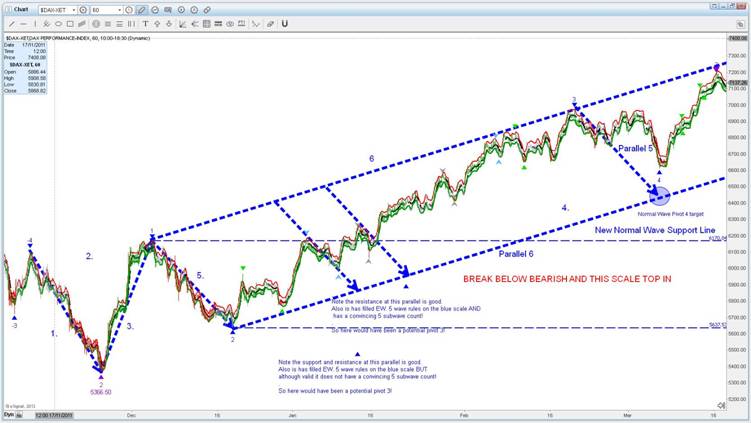
Also as we are looking for pivot 5 – which in Part 2 we saw wave 5 has an equal probability of extensions as wave 1, we use this as our starting probable pivot 5 area as shown below. We have this frequency from our fork used for parallel 5 and draw parallel 7 between pivots 4 and 4 and slide this to the intersection of the fork (wave or cycle) to give our target for pivot 5 which is also the next pivot on the next greater scale as shown below, and again we could draw in our alternate wave target as we previously did but because it has the same probability of subwaves as wave 1 if the wave count would not look probable at that point I would add it..
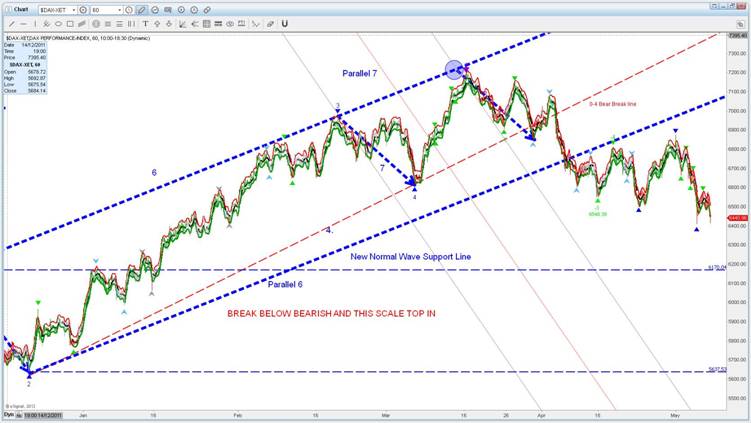
An extremely high probability trend change line is the 0to4 trend line. Once this is broken the there is over a 80% chance that a new trend has started. So as you can see the 0-4 trend line has narrowed our trading range again and depending on the pivot scale you are trading you might be using this as one of your trend break tools – so if you were trading daily pivots you would use this as one of your short signals in conjunction with applying the same techniques one pivot scale down.
So what are my current trading parameters?
Once pivot 5 is in we start the process again! Below I have added the D13TL (trend line from daily – purple pivots 1 to 3 as well as its parallel..(Also shown are alternate targets for -1 and D-1)
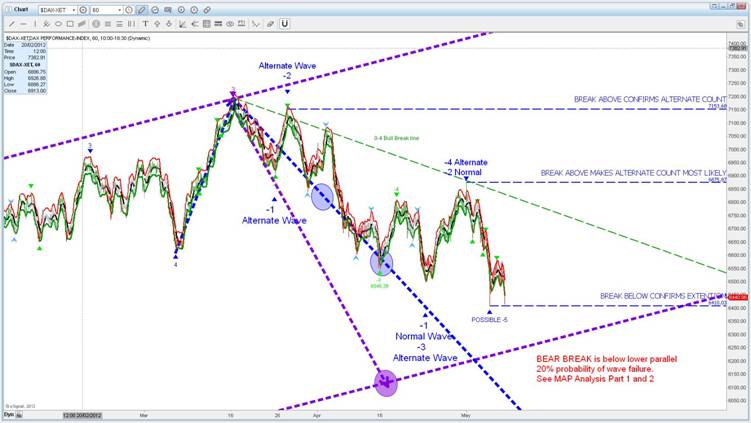
With the blue pivots I have shown alternative and normal wave counts. – BOTH ARE VALID AT THIS POINT as those of you who read Part 3 know this BECAUSE OF THE LAW OF ALTERATION.
A break below the lower purple cycle (parallel or normal) line has a 20% probability and would be bearish but due to the law of alteration if daily wave 1 was an alternate simple wave then this may be a complex wave 4 so we would draw an equidistant purple parallel below the lower one as our alternate support line, and that is a valid possibility BEFORE we have a wave count failure which would occur with a break below D2 of 5366.50.
So is the world over yet? No. Is it possible we are facing abyss. Yes. How probable is it? From part 2 Daily waves have a 0% failure and 4H waves have a 20% failure – BUT THAT IS ONLY BASED ON THE LAST 20 YEARS DATA AND THIS POINT IN TIME AS THOSE OF YOU WHO READ ALL THE PARTS KNOW – So no elephants in the room yet!
Technically using my daily pivots on the indices I follow, they show we need to make 1 more high after this correction is over to put in wave 5 on the daily pivot scale which completes wave 5 on the monthly pivot scale which is when it is going to get scary.
So 80% probability of QE3 because the fundamentals don’t justify a rising market and politicians WILL NOT change their behavior of doing anything to keep their positions of power – history will repeat itself unless we start to learn from it! O
I hope you now have a fuller understanding of one method I use for my forecasting – or rather TRADING PARAMETERS.
I chose to demonstrate this method which is all basic, basic Elliot Wave stuff that anybody can find freely on the net – or you can pay loads and get none of this.
Worse I think in this series more than adequately demonstrated. and substantiated, the misleading claims of experts who claim to base their advice, and in many cases your investments, on methods that are no better than 50% if you have us in a corrective cop out pattern which could go up or down! I also can flick a coin and save myself money!
So all you experts – I have highlighted a market opportunity for you – that of quality analysis. If I can do this as an amateur you as an expert should be doing much better!
Get over your pride and give the public what they want which many may not be able to do for themselves for whatever their reason.
PUT PRINCIPLES ABOVE PROFIT – MAKE PRICIPLED PROFITS – That is what sustainable capitalism is where the rubbish should be allowed to fall by the wayside to innovate new ideas to generate new wealth!
For more information of how I do what I do http://mapportunity.wordpress.com/ . Comments and discussions very welcome!
The statements, opinions and analyses presented in this site are provided as educational and general information only. Opinions, estimates, buy and sell signals, and probabilities expressed herein constitute the judgment of the author as of the date indicated and are subject to change without notice.
Nothing contained in this site is intended to be, nor shall it be construed as, investment advice, nor is it to be relied upon in making any investment or other decision.
Prior to making any investment decision, you are advised to consult with your broker, investment advisor or other appropriate tax or financial professional to determine the suitability of any investment.
© 2012 Copyright Marc Horn - All Rights Reserved Disclaimer: The above is a matter of opinion provided for general information purposes only and is not intended as investment advice. Information and analysis above are derived from sources and utilising methods believed to be reliable, but we cannot accept responsibility for any losses you may incur as a result of this analysis. Individuals should consult with their personal financial advisors.
© 2005-2022 http://www.MarketOracle.co.uk - The Market Oracle is a FREE Daily Financial Markets Analysis & Forecasting online publication.