


Stocks Bear Market Focus Point: Bull Trap confirmed – Following the leaders
Stock-Markets / Stocks Bear Market May 10, 2012 - 01:28 AM GMTBy: Garry_Abeshouse

 Bull Traps at major market peaks are defined by failed upside breakouts. These short lived breakouts usually coincide with unrealistic and often delusional and ill-informed expectations of the future – hence the name. It is no accident that these emotional times also coincide with peak optimism and volume, not necessarily for the markets as a whole, but certainly for the market leaders. In this case it’s Apple.
And if this is really THE BULL TRAP pertaining to the peak of the current three year market top in equities and commodity prices, then price falls morphing into a full scale breakdown and a continuation of the bear market that more or less started in 2000, may become the new reality.
And talking of Apple.
As the recent full moon wreaked its havoc on the market psyche, flying pigs were appearing everywhere, with some ‘investment’ newsletters calling the Apple price cheap and we should be buying into weakness to take advantage of future prices ranging from $750 to $1000 a share. But fortunately some sanity has prevailed.
The May 1st, MarketWatch article below suggests that the ‘trading velocity’ of Apple shares combined with the high proportional take-up by large institutional investors may make the market as a whole oversensitive to changes in sentiment from a single stock. Whereas comparative volume levels over a given time frame, inaccurate as they are, may be charted quite easily on graphs, the ‘trading velocity’ of an entire listed company or group of companies is an interesting statistic that is not readily available.
The article notes that Apple’s share of the Nasdaq 100 Index stands at 17% and that “Apple turns over its float every 50 days, while a mere three months ago the trading velocity of Apple was only half that, as it turned its float over every 100 days. When we speak of velocity, we mean the number of shares traded relative to the stock’s float. Apple has a float of 923 million shares and trades 26,086,000 shares a day on average as measured by the 50-day moving average of daily trading volume. This adds up to 1,304,300,000 shares traded over the last 50 days, well in excess of Apple’s 932,000,000 share float. That is an astounding number of shares, even for Apple, and a tremendous amount in terms of dollar value.
When you talk about Apple, you are talking about a true “big stock,” and this much money moving into and out of Apple, mainly as a result of the activity of institutional investors — mutual funds, hedge funds, pension funds, etc. — increases the correlative nature of Apple to the overall markets, and thus the overall risk in being exposed to such an environment.
Apple has been the key leading stock in the current market environment, with mutual funds alone owning about 37% of the stock — over 366 million shares. When funds start to pile out of an over-owned stock, it can create a landslide effect, though it could be argued that 37% is not at extreme levels.”
On May 7th another writer, this time from Seeking Alpha wrote:
“It should be noted that Apple accounts for 18% of PowerShares Nasdaq 100 (QQQ). If you’re hesitant about single-company exposure, there are several Nasdaq 100 equal-weighting alternatives from First Trust to consider. There’s the FT Nasdaq 100 Equal Weighted Index Fund (QQEW) where Apple’s weight will stay near 1%, and there’s FT Nasdaq 100 Technology Sector (QTEC), where Apple’s weight should stay near 2.5%.”
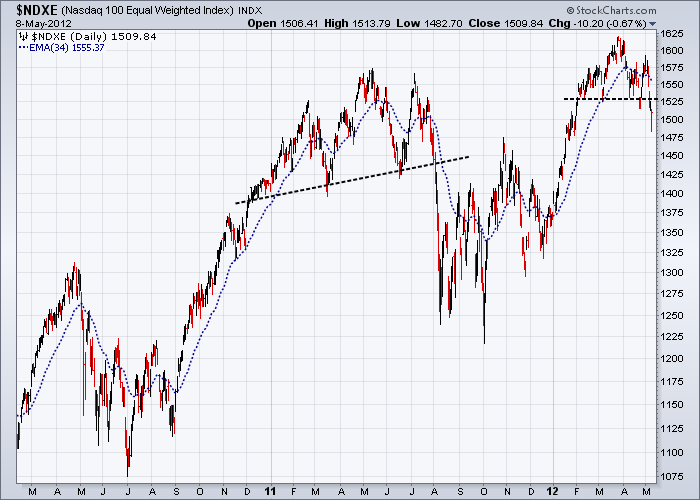
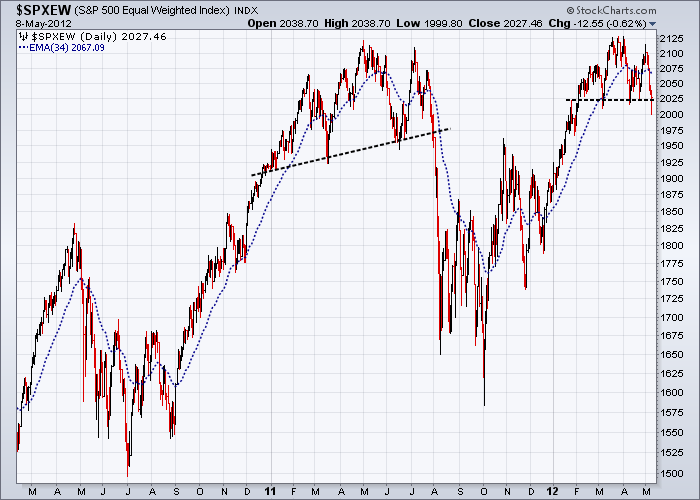
This is why I prefer using equal weighted index charts over market capitalisation based ones.
Following the Leaders
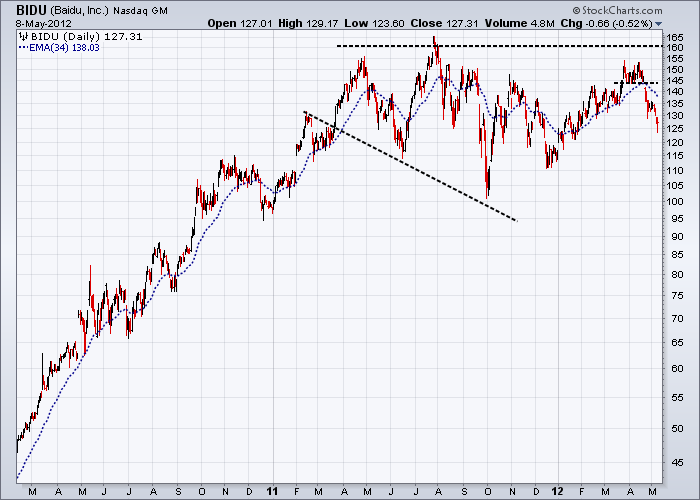
If Apple has been the darling of the institutional investors over the last three years, then Baidu has been China’s internet darling.
The Apple price, as against the price of apples, rose from its post financial apocalypse low of $78.20 in early 2009 to the dizzy heights of $644.00 only a few short weeks ago. By contrast Baidu rose from $10.05 in early 2009 to peak at $165.96 in July 2011 (prices adjusted for the 10 to 1 stock split in May 2010, just after Baidu had reached a high of around $700 per share).
Wikipedia describes “Baidu, Inc. (pronounced like BY-doo in English, NASDAQ: BIDU), incorporated on January 18, 2000, as a Chinese web services company offering many services, including a Chinese language search engine for websites, audio files, and images. Baidu offers 57 search and community services, an online collaboratively built encyclopaedia, and a searchable keyword-based discussion forum. Baidu is currently ranked 5th overall in the Alexa Internet rankings. In December 2007, Baidu became the first Chinese company to be included in the NASDAQ-100 index.”
“Baidu provides an index of over 740 million web pages, 80 million images, and 10 million multimedia files. Baidu offers multimedia content including MP3 music and movies, and is the first in China to offer Wireless Application Protocol (WAP) and personal digital assistant (PDA) based mobile search.”
And according to MarketWatch on May 8th 2012:
“In China, Google's market share of close to 34%, plays second fiddle to Chinese giant Baidu who holds a 61% market share. Baidu, Inc. is now the leading Chinese language Internet search provider. In addition to serving individual and business Internet search users. The company reported total revenues of $677.1 million for the first quarter of 2012, representing a 75.0% increase from the corresponding period in 2011.”
Bull Trap Confirmed
If major market peaks are defined by the price movements of their leaders, then recent market highs should be defined by the price movements of Google, Baidu and Apple – they being the key players of their time and most importantly, the company names foremost in the psyche of the tech-savvy population at large. This is why Baidu’s recent price failure shown below, is to me one important early sign that the Bull Trap has been sprung.
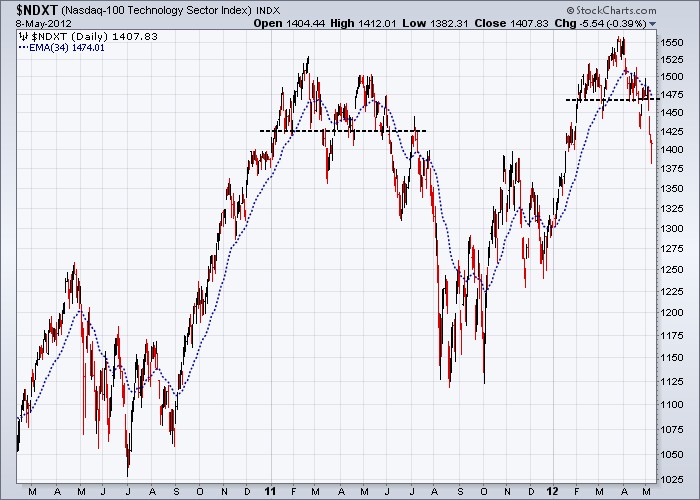
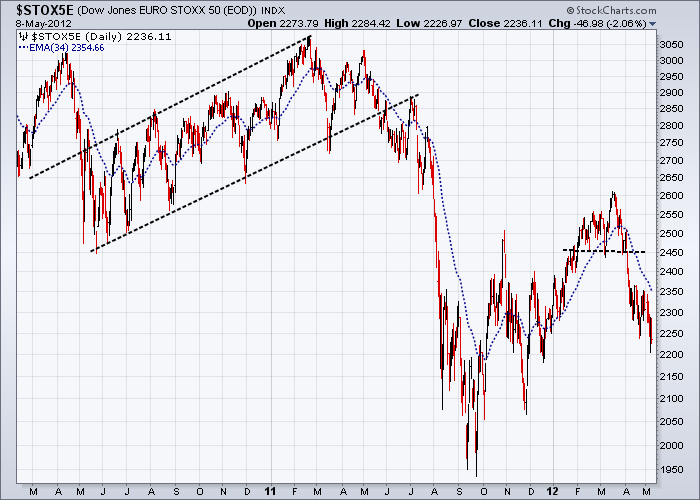
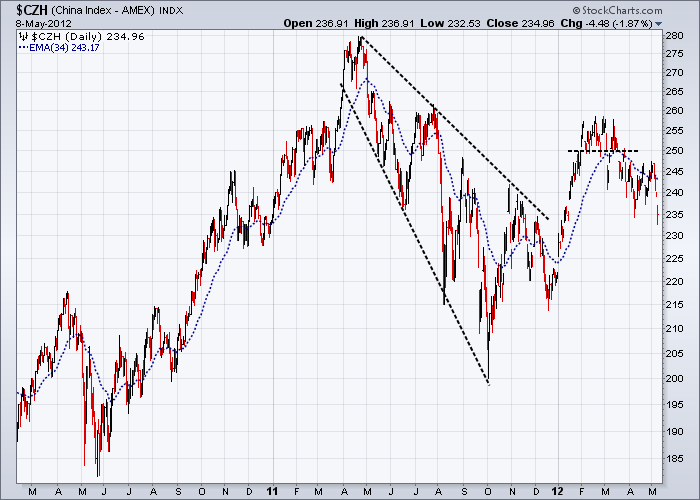
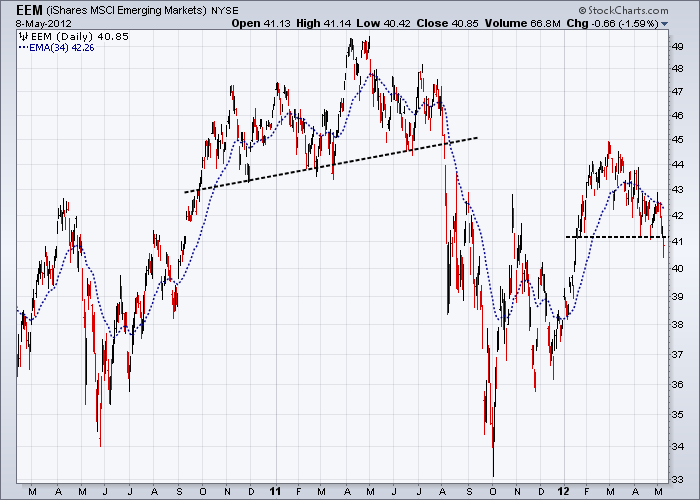
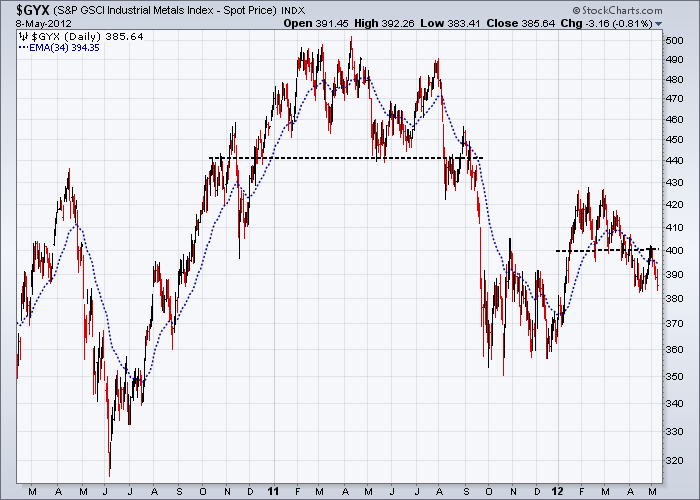
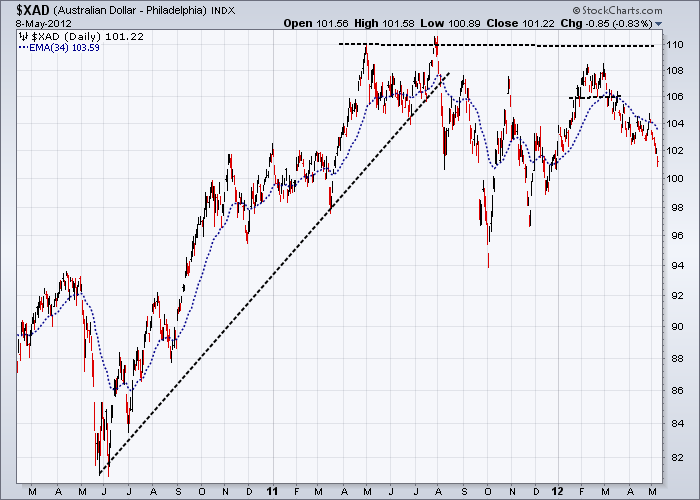
We are now seeing multiple confirmations of being in a post Bull Trap market, shown by the high degree of conformity displayed by the daily charts below. And while the vertical price positioning of these markets varies considerably, the horizontal time based conformity is extremely close – as it should be, if this really is the re-emergence of the Primary Bear Market.
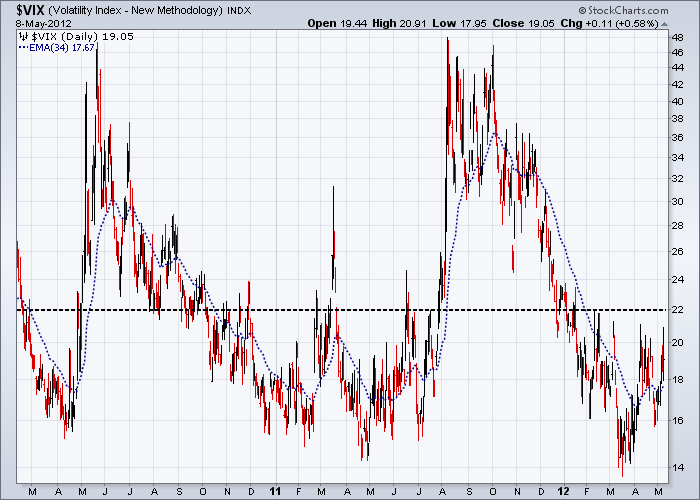
As I write these words, the short term support lines on the daily charts continue to fail. Neckline support from the Head & Shoulders tops on the weekly charts from my April 21st posting are still holding, albeit on very weak volume – and this can’t be a good look for the Bulls. And while the Bears gain strength, it seems the VIX Indicator remains oblivious – with the Bulls stuck in that faraway place where complacency rules and fantasises of perpetually rising markets provide comfort in their dreams as they sleep.
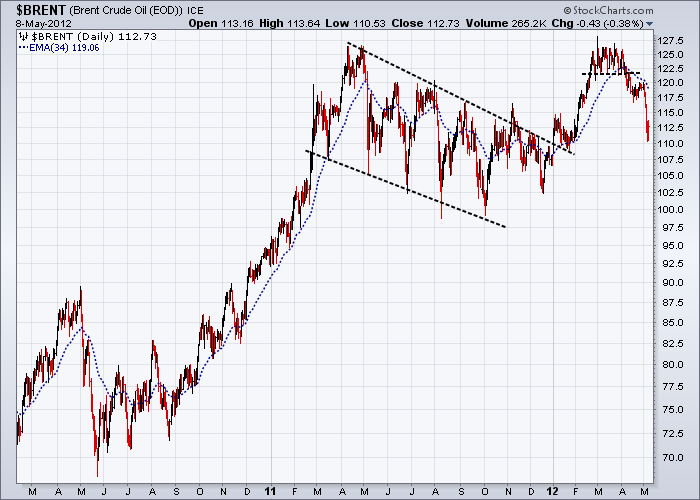
The highly traded hard commodity orientated AUD and the Oil price are also conforming to this scenario as can be seen by the close correlation of these charts to the others. I have chosen the Brent Crude Oil chart over West Texas Crude, because it is a better illustration of what a text book Bull trap should look like.
The advanced state of the breakdown in the Nasdaq 100 Equal Weighted Tech Index also illustrates how quickly the prices have deteriorated in this most important market sector, just over the last few days.
The final words this week from Robert Reich writing on “The Tinderbox Society”, deserve some serious reflection and introspection.
‘Austerity economics in Europe is fanning the flames, as public budgets are slashed on the false crucible of fiscal responsibility. In the United States, an anaemic recovery and plunging home prices are taking a toll: a large portion of the public believes the game is rigged, and no longer trusts that the major institutions of society – big business, Wall Street, or government – are on their side. In Europe and America, 30 to 50 percent of recent college graduates are unemployed or underemployed.
Inequality is also widening in China, where the scandal surrounding Bo Xilai and his family is serving as a public morality tale about great wealth and official corruption. Students in Chile are in revolt over soaring tuition and other perceived social injustices.
It’s a combustible concoction wherever it occurs: Increasing productivity, widening inequality, and rising unemployment create tinder-box societies.
Public anger and frustration can ignite in two very different ways. One is toward reforms that more broadly share the productivity gains.
The other is toward demagogues that turn people against one another.
Demagogues use fear and frustration to advance themselves and their own narrow political agendas – scapegoating immigrants, foreigners, ethnic minorities, labor unions, government workers, the poor, the rich, and “enemies within” such as communists, terrorists, or other conspirators.
Be warned. The demagogues already are on the loose. In Europe, fringe parties on the right and left are gaining ground. In America, politics has turned especially caustic and polarized. (The right is even accusing people it doesn’t like of being communists.) No one knows where China is heading, but reformers and ideologues are battling some of it out in public.’Till next time.
Garry Abeshouse
Technical Analyst.
Sydney
Australia
I have been practicing Technical Analysis since 1969, learning the hard way during the Australian Mining Boom. I was Head Chartist with Bain & Co, (now Deutsch Bank) in the mid 1970's and am now working freelance. I am currently writing a series of articles for the international "Your Trading Edge" magazine entitled "Market Cycles and Technical Analysis".
I specialise in medium to long term market strategies.
© Copyright Garry Abeshouse 2012
Disclaimer: The above is a matter of opinion provided for general information purposes only and is not intended as investment advice. Information and analysis above are derived from sources and utilising methods believed to be reliable, but we cannot accept responsibility for any losses you may incur as a result of this analysis. Individuals should consult with their personal financial advisors.
© 2005-2022 http://www.MarketOracle.co.uk - The Market Oracle is a FREE Daily Financial Markets Analysis & Forecasting online publication.