


Have Gold, Silver, and Mining Stocks Bottomed?
Commodities / Gold & Silver Stocks Jun 06, 2012 - 04:05 AM GMTBy: J_W_Jones

 On Friday, the price action in gold caught the attention of most market participants as gold put in a monster move to the upside in light of risk assets such as the S&P 500 selling off sharply. In fact, gold futures rallied nearly $58 per troy ounce on Friday (+3.71%) while the S&P 500 Index sold off over 32 handles (-2.46%).
Monday saw some profit taking in gold and silver futures as Friday’s monster gains had to be digested. Short term traders were locking in profits, but overall the price action remains quite bullish at the moment. The gold miners remained extremely strong into the bell on Monday as buyers bid up prices in the afternoon to push them nearly 1.65% higher for the trading session.
Long time readers understand that I am a gold bull in the longer-term and have been for quite some time. Unlike some gold bugs, I will discuss the downside in precious metals from time to time even though it generally fills up my email inbox with some rather rude and hate-filled emails.
My view of gold and silver is that they are senior currencies. With that being said, I monitor the value of gold in U.S. Dollars and recognize that a stronger U.S. Dollar in the longer-term is not necessarily bullish for gold. Yes both gold and the Dollar can rally together, but mutualistic price action generally does not last for long periods of time.
Obviously I monitor the price action of the U.S. Dollar Index futures on a regular basis to help me gauge when the Dollar is at key turning points regarding price action. Back on May 5th I penned an article titled “The Dollar & Gold have Eyes on Europe” where the following chart and statements were made:
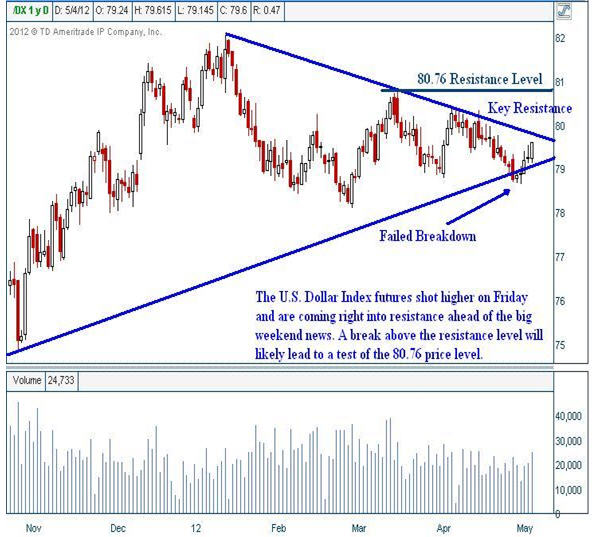
“The key level to watch is the 80.76 price level on the U.S. Dollar Index futures. If that level gets taken out, the Dollar could extend to recent highs and beyond should the situation in Europe begin to unravel.”
A few weeks have passed since I posited that chart and statement to readers and time has proven my analysis wise. On May 14th the U.S. Dollar took out the overhead resistance at the 80.76 price level and has since worked even higher taking out the resistance level around the 82 price point.
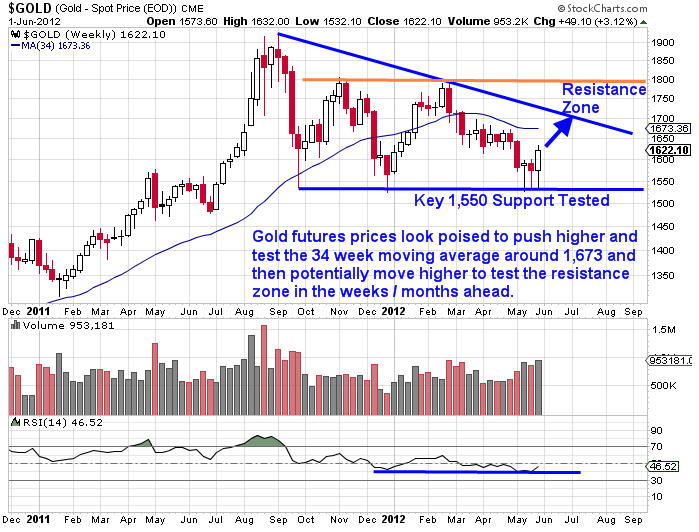
In the same article, I discussed my expectations for gold prices in the intermediate term as quoted from the gold chart below:
“My expectation is that we may test the key support area [1,550 – Gold Spot Price] one more time, but price will likely breakout to the upside when this pattern is finally triggered.”
The gold futures weekly chart shown below illustrates how we tested the key support level as discussed above and a major bounce to the upside appears to be unfolding.
While we could see some short-term consolidation, I continue to believe that gold prices are likely to climb higher. In addition to the safe haven status, should an all-out currency crisis begin to unravel in Europe, gold and silver will be viewed as safe havens to protect European citizens’ and corporations’ wealth against a faltering Euro.
In fact, all ways out for Europe are positives for precious metals. If a currency crisis takes place and countries default, money will pour into gold and silver as Europeans attempt to protect their purchasing power.
However, politicians are not going to allow governments to default without a fight. Instead I suspect more and more pressure will be placed on the European Central Bank (ECB) to print piles of Euros. Both outcomes are bullish for gold and silver in the intermediate to longer-term time frames. In fact, the fundamental case for gold seemingly continues to build as central banks around the world print vast sums of money and multiple currency crisis scenarios are likely to transpire.
Silver has actually outperformed gold recently during this selloff. Unlike gold, silver did not quite test the recent support zone. In light of this divergence, I would not rule out the potential for one more move lower in gold and silver that might trigger stops on the other side of key support.
I do believe that probabilities favor that we have bottomed in precious metals, but there is always a chance of one last push lower to shake out weak bulls. The weekly chart of silver futures is shown below.
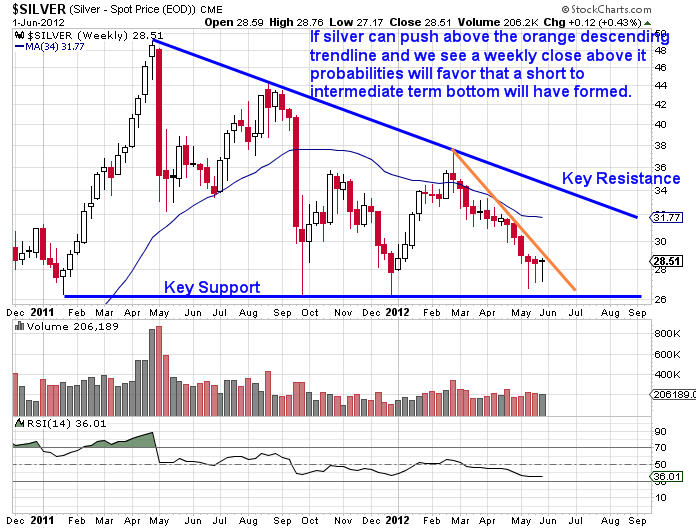
The weekly chart of silver futures shown above demonstrates how silver outperformed gold on the recent selloff as silver failed to test key support. However, gold has started to show out performance to the upside which is most obvious when comparing the strength seen on Friday.
While both gold and silver appear likely to have formed a major bottom or are in the process of forming a major bottom, I continue to believe that gold miners are offering more potential upside. The gold miners have been absolutely crushed the past few months.
Back on February 29th of this year, the Market Vectors Gold Miner’s ETF (GDX) made a high of $57.91 / share that day. The most recent low which occurred on May 16th saw GDX trade as low as $39.08 / share. The move over the course of only a few short months produced a loss over 32% for investors that held an unhedged position.
From a fundamental standpoint, valuations have become close to levels not seen since the lows which formed during the financial crisis in 2008 and 2009. However, an excerpt from James Turk’s analysis which recently was published in “Things That Make You Go Hmmm” by Grant Williams is certainly worthy of discussion.
Turk produced the following 30 year chart which depicts the amount of gold in grams and ounces required in order to purchase 1 unit of the gold mining index (XAU). The gold mining index is very similar to the HUI Gold Bugs Index or the Market Vectors Miners ETF (GDX).
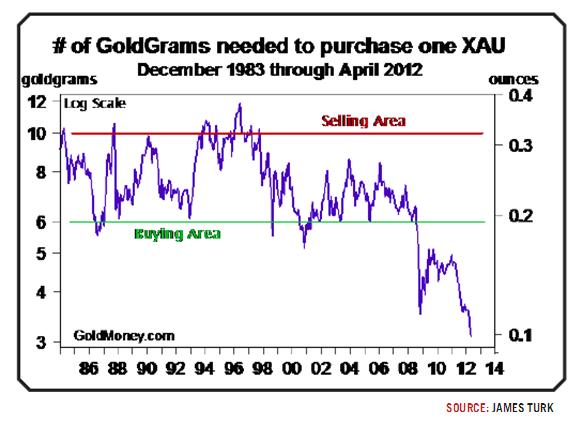
The following quote comes from James Turk where he references the chart shown above:
“I want readers to take a look at the following 30 year chart which I believe is the most important and extraordinary chart for 2012. It presents the XAU Gold Mining Index measured in terms of gold, not dollars. We’re making history here. Gold stocks have never been this undervalued before.”
The chart above speaks for itself. Long-term investors looking for deep value should look no further than the gold miners for opportunities. In the past 30 years, they have never been this cheap relative to the price of gold.
Obviously gold miners have rebounded sharply from their recent lows the past few weeks. In the longer term they are still extremely oversold, but in the short run a pullback to back test a variety of key support levels may be warranted.
Should a pullback occur, I think it will likely mark an excellent buying opportunity in the intermediate to longer term. The daily chart of the Market Vectors Gold Miners ETF (GDX) is shown below.
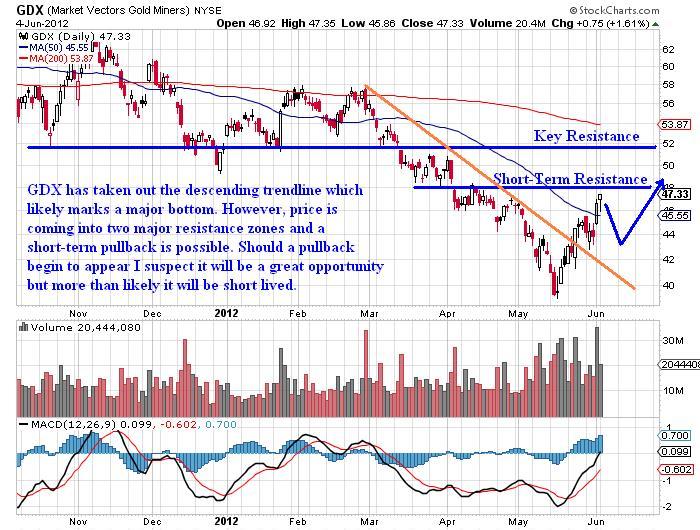
GDX could very well power right on through the short-term resistance level, but I would be surprised if it could push through the intermediate term resistance near the 52 price level on its first attempt. A pullback here would be quite healthy, but Mr. Market may not offer that opportunity. Right now the gold miners clearly have a strong valuation argument to consider them at a value presently.
In addition, we are seeing the U.S. Dollar Index futures start to roll over while gold and silver futures are trying to form bottoms and build consolidation bases to move higher from. If this is a major top in the Dollar, then gold, silver, and gold miners are on sale as we speak. The next few months will tell the real story, but in the longer term this may go down as an unbelievable buying opportunity that most investors will miss entirely.
Test drive our video analysis and trade idea service for only $1 – www.TradersVideoPlaybook.com
 If you are looking for a simple one trade per week trading style then be sure to join www.OptionsTradingSignals.com today with our 14 Day Trial.
J.W. Jones is an independent options trader using multiple forms of analysis to guide his option trading strategies. Jones has an extensive background in portfolio analysis and analytics as well as risk analysis. J.W. strives to reach traders that are missing opportunities trading options and commits to writing content which is not only educational, but entertaining as well. Regular readers will develop the knowledge and skills to trade options competently over time. Jones focuses on writing spreads in situations where risk is clearly defined and high potential returns can be realized.
This article is intended solely for information purposes. The opinions are those of the author only. Please conduct further research and consult your financial advisor before making any investment/trading decision. No responsibility can be accepted for losses that may result as a consequence of trading on the basis of this analysis.
© 2005-2022 http://www.MarketOracle.co.uk - The Market Oracle is a FREE Daily Financial Markets Analysis & Forecasting online publication.