


Gold Technical's Suggest Downtrend is Looming
Commodities / Gold & Silver Jan 27, 2008 - 09:47 PM GMTBy: Merv_Burak

 Despite a 3.4% gain on the week one gets the impression that gold is ready to go lower. That's not what most analysts are saying. Who to trust? I always prefer the charts to tell me where gold is going not where it should go.
GOLD: LONG TERM
The long term continues in its bullish mode with some hints of weakness but no overriding concern. Gold continues to trade well above its long term moving average line and the line continues to slope upwards. The long term momentum indicator continues in its positive zone above its positive sloping trigger line but is showing some minor hint of weakness by not making a new high with the gold price. The volume indicator is also above its positive sloping trigger line but below its previous high and not confirming the gold move to new highs. The long term P&F chart continues to move higher with no hint of a reversal in the works. So, from the long term point of view the only rating that I can give this time period is a BULLISH rating.
INTERMEDIATE TERM
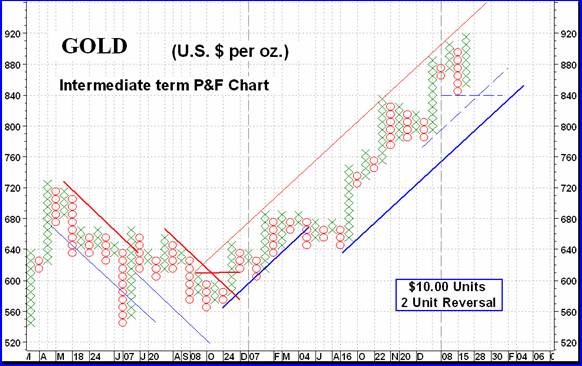
Since breaking into a new intermediate term bull market in the first week of November 2006 the P&F chart has remained in a bullish mode. Long time readers of these commentaries understand the two criteria required to reverse a trend in my P&F charts, that being a break above two previous highs (or lows) and a move above the down trend line (or up trend line). In a bull market we now are looking for a break below lows and the up trend line (see dash lines). Both of these events are still very far away so from a P&F stand point the intermediate term bull continues and is showing no immediate signs of reversing. On the chart, the blue lines are up trend or support lines while the red lines are down trend or resistance lines.
The normal indicators are telling us a similar story to that of the P&F chart. Gold continues to trade well above its positive sloping moving average line. The intermediate term momentum indicator is well entrenched inside its positive zone and above its intermediate term trigger line. The trigger line has once more turned upward for another positive. However, the momentum indicator has not moved into new high territory to confirm the price action and this is a minor (at this time) negative. And lastly, the volume indicator has moved further above its positive sloping intermediate term trigger line. Unfortunately the volume indicator is still some distance below its previous high set during the gold high in early November and this seems to suggests speculators are not yet fully convinced that gold will continue much higher. For now, however, all is in place and BULLISH is the only logical rating to give the intermediate term.
SHORT TERM
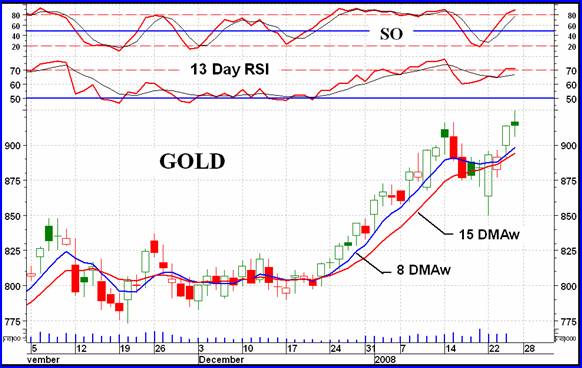
This is where we should first notice any change in the trend of the gold price. What we see is gold making a new all time high (well, all time at least as living memory is concerned and not taking inflation into account) but not with any great degree of vigor. First, the Friday action suggests that the day was somewhat unconvincing in that, although the price closed on the up side the close was lower than the morning open so I would be more inclined to go with the lower close perspective. It could just suggest more to come on Monday, but of course there are two days in between and anything could happen to spoil an analysis. To go along with this suggestion that the price actually closed lower (due to the opening price) is the short term momentum indicator that did not reach new highs to confirm the price move into new highs. Both the short term RSI and more aggressive Stochastic Oscillator are in their overbought zones and could be ready for a short trend turn. Going strictly with the indicators the short term is still BULLISH or at worst, + NEUTRAL and will remain so until a turn around has been validated. There are warnings to expect a turn but it has not yet occurred. A move below 890 may just make the turn.
NORTH AMERICAN GOLD INDICES
Today we look in on the Dow Jones Precious Metals Index. Of the five that I review here in rotation it is probably the least known or followed. It does, in most respects, follow the trends of the other Indices.
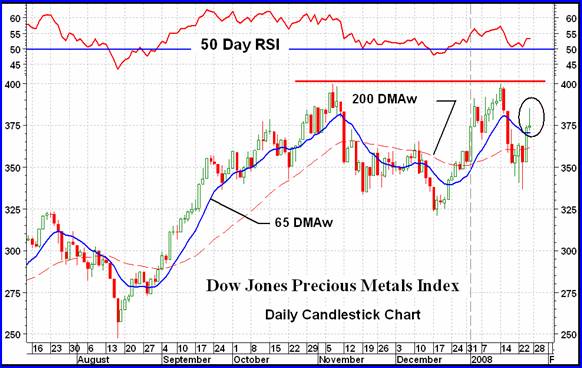
The first thing one notices about this Index is the double top that it has created. This is often a very bearish pattern but is only confirmed AFTER the Index has moved below the low set in between the two highs. In this case it is the low of mid-December. Too often analysts pronounce a double top in effect as the price reaches the previous high level. It could just as easily, at that time, be a temporary rest on its way to new highs above the previous one. The only confirmation of a bearish double top is when the price breaks into a lower low.
The second interesting feature one notices is that Friday action. This is what some might call an inverted hammer or a long upper shadow pattern. Whichever you call it it has the same interpretation, i.e. a bearish reversal to be confirmed by the next day's action. So, the odds are for a further deterioration of the Index, possibly towards the previous low level to confirm the potential double top. Something to watch out for. Wait for the Monday's action and see how the wind is blowing before jumping in on the buy side.
MERV'S PRECIOUS METALS INDICES
Due to difficulty in obtaining data from my data vendor this week-end I am very far behind in my commentaries. I will be simplifying the rest of the commentary this week.
If one takes away the U.S. Dollar Index and the special situation in Africa with their power problems we are left with the clear indication that the only Indices with difficulty making it to the plus side were Indices that were heavy with the speculative stocks. They were the losers during the week. Overall, however, the Composite Index gained on the week, but only a little, after a serious loss last week.
MERV'S GOLD & SILVER 160 INDEX
The universe of 160 stocks is loaded with the more speculative kind. There are only so many larger, quality precious metal stocks (see the Merv's Qual-Gold Index) so everything else can be seen as speculative. The universe lost on average 0.4% of its value. At 81 winners (51%) there were just a few more of them than losers, at 71 (44%). Those stocks on the losing side lost just a shade more, % wise, than the gainers gained to give us a negative Index move. The other important breadth indicator is the summation of individual stock ratings. Here things changed for the worst. The short term moved from a bullish rating last week to a BEAR 53% this week. The intermediate term also changed from a bullish rating to a BEAR 60%. The long term moved in the same direction but by not as much and only went from a previous bullish rating to a NEUTRAL one with neither bull nor bear in control. As for the ratings of the Index itself, I'll go with the Table ratings this week.
MERV'S QUAL-GOLD INDEX : MERV'S SPEC-GOLD INDEX : MERV'S GAMB-GOLD INDEX
Here we once more see the typical flight to quality during a time when investors/speculators are unsure of the trend of the market. The Qual-Gold Index gained 3.0%, the Spec-Gold Index gained 1.8% while the Gamb-Gold Index lost 3.7%. The more speculative the stock the worse the performance during the week. It is interesting to note that after being the leading Index since the bull market in gold stocks started the Gamb-Gold Index has, for the past several months, become the laggard Index. Speculators have not been gravitating towards the more speculative stocks, other than the odd special situation here and there. The change in the herd mentality towards these stocks is not a good sign for the universe ahead. We need to see a general plunge by speculators and the masses into the more speculative stocks to know that the mood is very bullish in general. One can hope this trend changes in the weeks and months ahead.
SILVER
There is good news and bad news for silver. Over the short and intermediate term it has out performed gold but this past week and in the longer term silver has under performed relative to gold. The Qual-Silver Index gained less than the Qual Gold Index. The Spec-Silver Index is a combination of speculative and gambling type of stocks. The Index here lost more than an average Spec and Gamb-Gold loss.
I am expecting a rough week ahead but in the end let the direction of the market itself dictate which way is which.
Merv's Precious Metals Indices Table
That's it for this week.
By Merv Burak, CMT
Hudson Aero/Systems Inc.
Technical Information Group
for Merv's Precious Metals Central
Web: www.themarkettraders.com
e-mail: merv@themarkettraders.com
Before you invest, Always check your market timing with a Qualified Professional Market Technician
For DAILY Uranium stock commentary and WEEKLY Uranium market update check out my new Technically Uranium with Merv blog at www.techuranium.blogspot.com .
During the day Merv practices his engineering profession as a Consulting Aerospace Engineer. Once the sun goes down and night descends upon the earth Merv dons his other hat as a Chartered Market Technician ( CMT ) and tries to decipher what's going on in the securities markets. As an underground surveyor in the gold mines of Canada 's Northwest Territories in his youth, Merv has a soft spot for the gold industry and has developed several Gold Indices reflecting different aspects of the industry. As a basically lazy individual Merv's driving focus is to KEEP IT SIMPLE .
To find out more about Merv's various Gold Indices and component stocks, please visit www.themarkettraders.com and click on Merv's Precious Metals Central . There you will find samples of the Indices and their component stocks plus other publications of interest to gold investors. While at the themarkettraders.com web site please take the time to check out the Energy Central site and the various Merv's Energy Tables for the most comprehensive survey of energy stocks on the internet. Before you invest, Always check your market timing with a Qualified Professional Market Technician
Merv Burak Archive |
© 2005-2022 http://www.MarketOracle.co.uk - The Market Oracle is a FREE Daily Financial Markets Analysis & Forecasting online publication.