


Is the Stock Market SPX Index Resuming its Intermediate Downtrend?
Stock-Markets / Stock Markets 2012 Jun 25, 2012 - 03:11 AM GMTBy: Andre_Gratian

 Current Position of the Market
SPX: Very Long-term trend - The very-long-term cycles are down and, if they make their lows when expected (after this bull market is over) there will be another steep and prolonged decline into late 2014. It is probable, however, that the steep correction of 2007-2009 will have curtailed the full downward pressure potential of the 120-yr cycle.
SPX: Intermediate trend - SPX is probably putting the finishing touches on an intermediate-term bottom.
Analysis of the short-term trend is done on a daily basis with the help of hourly charts. It is an important adjunct to the analysis of daily and weekly charts which discusses the course of longer market trends.
Market Overview
After reaching its near-term target of 1363, the SPX started to correct. That correction was mild at first but, on Thursday, after Moody's downgraded 15 large global banks, the selling picked-up momentum and the index suffered its worst decline of the year, coming to rest on important support which, along with an extremely oversold near-term condition, primed it for a relief rally on Friday.
Moody's announcement must have taken the market by surprise because the VIX -- which is normally very good at anticipating reversals - showed that it had apparently no clue that this was coming by making a new correction low on Wednesday. Also, during the re-bound on Friday, the VIX showed significant relative weakness to the SPX, bringing into question the amount of weakness displayed by equity indices on Thursday, and its implication for the future trend.
Some guidance could come from the action of UUP and the Euro. These two indices trade in inverse manner. On Thursday, FXE was down sharply and, consequently, UUP was up proportionally. However, neither index was able to break its respective short-term trend line. Until they do, UUP remains in a downtrend, and FXE in an uptrend. Where they go from here will have a significant effect on the SPX. Since the Euro is directly affected by Eurozone developments, and since an important two-day Eurozone summit is scheduled to start next Thursday, it is unlikely that much will happen in these two indices until then, but their future trend will be affected - at least near-term - by what decisions are taken by the participants. This could mean that the stock market will also be on hold until then, unless developments from another source affect it.
Chart analysis
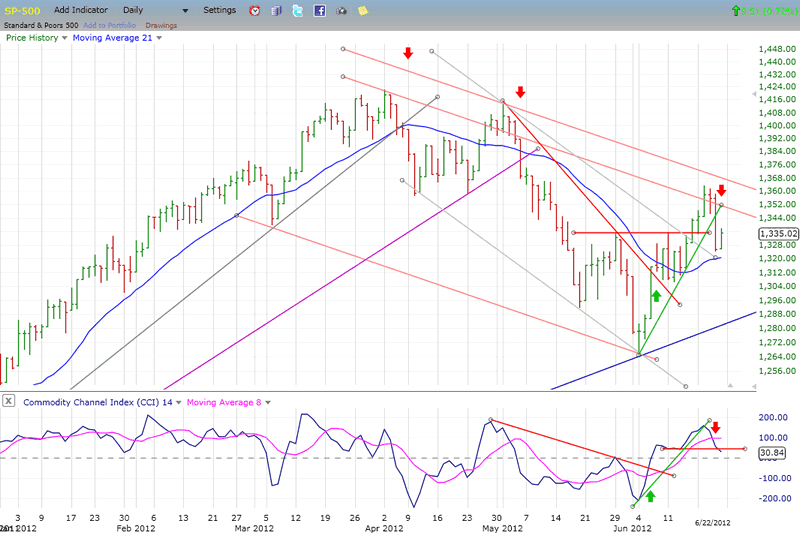
We'll first look at the SPX Daily Chart which, besides the fact that it had reached our projected target, gave us other clues that it was about to pull-back. Two channels have been drawn. The steepest one, in grey, was overcome after a brief interruption in the uptrend at the resistance level caused by a previous high. After a few more days, the uptrend reached the top of the more important intermediate channel which encompasses the entire corrective activity.
The SPX was not able to break out of the larger channel -- partly because it was over-extended. If you look at the indicator below, you will notice that it had risen close to 200. That often produces a pull-back, just as it did in early May. The same thing also tends to happen in reverse; the last two times that the indicator reached -200, a rally started.
Other factors warned us that a reversal was about to take place, but it did not tell us what kind of reversal. Is it simply going to be a minor affair to correct the overbought condition, or something bigger? That will depend on what happens next week, and the next few days of trading could bring some clarification. There are so many possible scenarios that it would be futile to make one up right now. All we can say for sure is that we have started a short-term downtrend and we'll have to wait for signs that it is over.
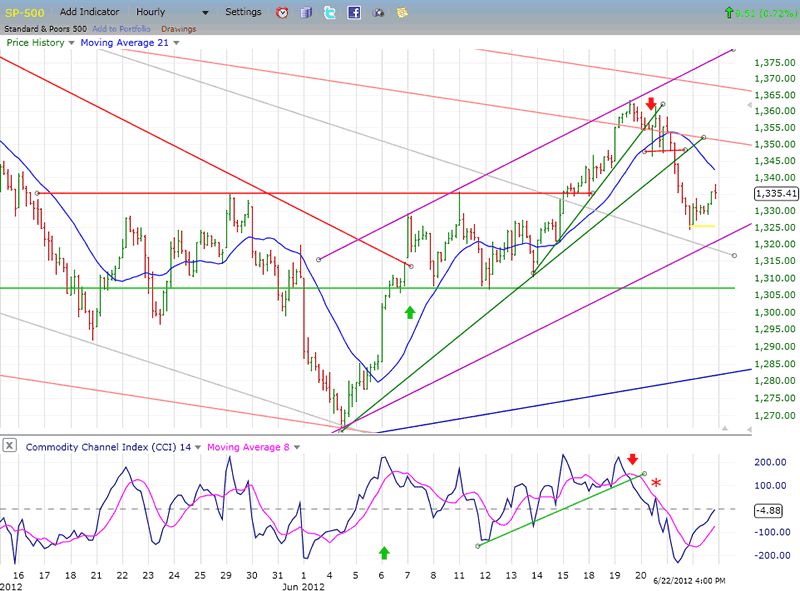
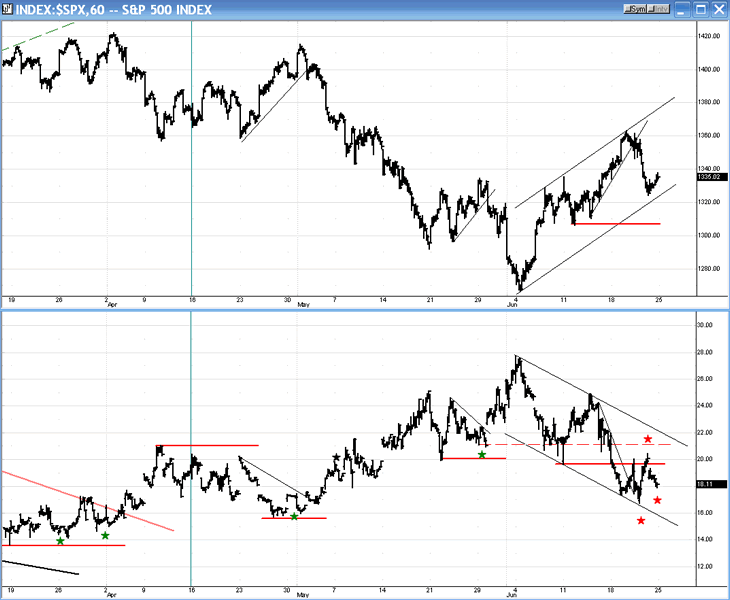
Let's now turn to the Hourly Chart and start with the trend lines. The red down-sloping trend lines at the top are the top of the intermediate channel mentioned earlier when we analyzed the daily chart. Next, the steepest of the two green trend lines represents the trend of the second phase of the market advance from the June low. When it was broken, we knew that we had found a near-term top. In fact, the SPX started to consolidate above the longer green trend line, seemingly in preparation for another attempt at extending the rally. Instead, Moody's announcement drove it straight through the longer trend line, ending the rally, and telling us that we should be ready for "something" on the downside, the extent of which is yet to be determined.
The decline came to rest on a strong support level, and a good rebound occurred on Friday, but not enough to reverse the downtrend. Note that the indicator at the bottom of the chart stopped right at the zero line. To signal a reversal, it would have to go through it and have some follow-through. This may take place on Monday, or we may roll over and continue the decline. If, in so doing, we stay within the up-channel, we'll have a better chance of reversing and extending the rally.
One more thing to point out on this chart! Have we just completed an inverted H&S pattern, and was the decline a pull-back to the neck line? If so, it would be very bullish, and we could expect to break out of the intermediate correction channel in the near future. For now, it's only a big MAYBE, and one of the potential scenarios which will need time to evaluate.
Cycles
Since last week's discussion about cycles is still pertinent, I am going to reproduce it verbatim:
"The ambivalence about the mid-June cycles is no longer an issue. They should bring about a high and not a low." (That prediction went well! Let's see if we do as well with the others.)
The 2-yr cycle is still definitely an issue, but it should be resolved shortly, possibly by Wednesday, depending on the statement that will be made by the FOMC. ( It's possible that we may have begun a decline into the 2-yr cycle - that is, if it did not bottom early at the beginning of the month. It's too soon to tell, and the current decline could simply be the work of the cycle which topped last week.)
Beyond that, the same 7-wk cycle could bring about another top in the first week of August, unless it is overridden by the 22-wk and the 36-wk cycles which are scheduled (to bottom) at the same time and which could turn that time frame into a low."
Breadth
The NYMO and NYSI (courtesy of StockCharts.com) are shown below.
After about a month of negative readings, the NYMO returned to the positive and, at the end of the week, finished well above the zero line in spite of the two-day weakness. It, too, had become overbought and was due to back off. What it does next week will also clarify what comes next.
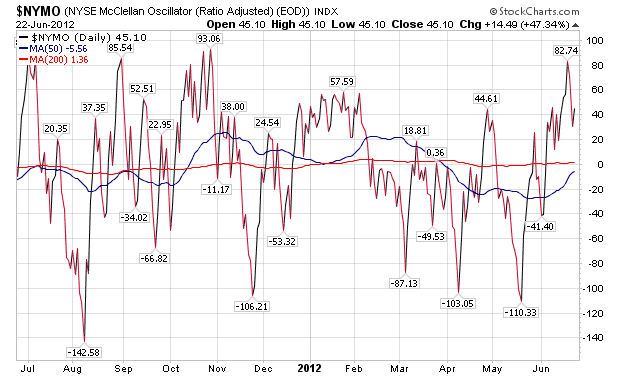
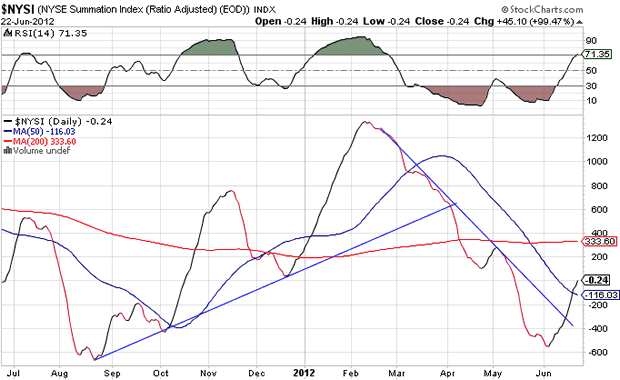
If the NYMO becomes negative once again, it will turn down the NYSI, and we'll be in danger of repeating the September/October pattern, with a lower price low, and a higher NYSI low - the perfect pattern for an intermediate market low.
Sentiment Indicators
The VIX
This is a 60-m chart of the SPX (top) vs. VIX (bottom). VIX has been very consistent at signaling reversals in the SPX on a short or longer-term basis. Last week there were several occasions when this failed to happen specifically, as it has in the past. On the other hand, if we compare 60-m charts of the two indices (chart courtesy of Qcharts) it is obvious that the weakness in the SPX is not being confirmed by equivalent strength in the VIX. This puts a question mark on what the SPX is doing and in which direction it will move from here.
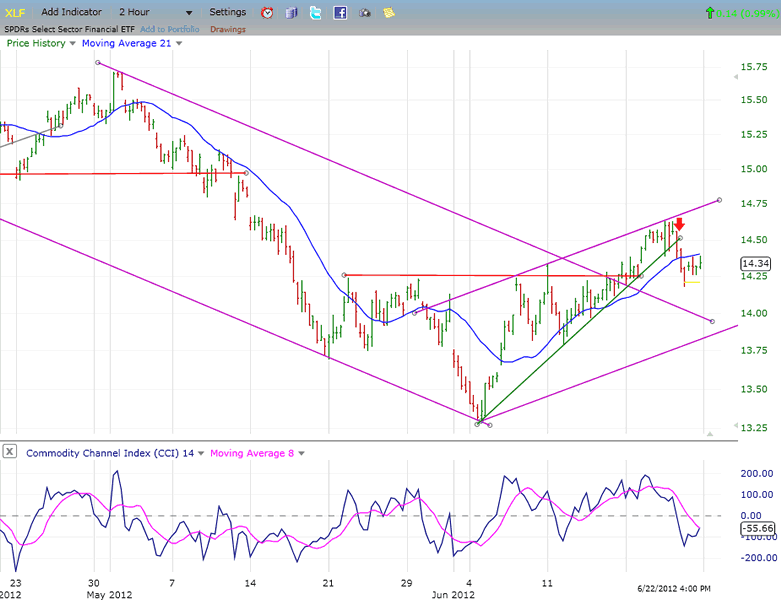
XLF (Financial SPDR)
The XLF was not quite as strong as the SPX during the rally. And, even though it has broken a short-term trend line, it is not quite as weak as the SPX on the pull-back. It does not have any predictive value at this time. We'll analyze it further next week.
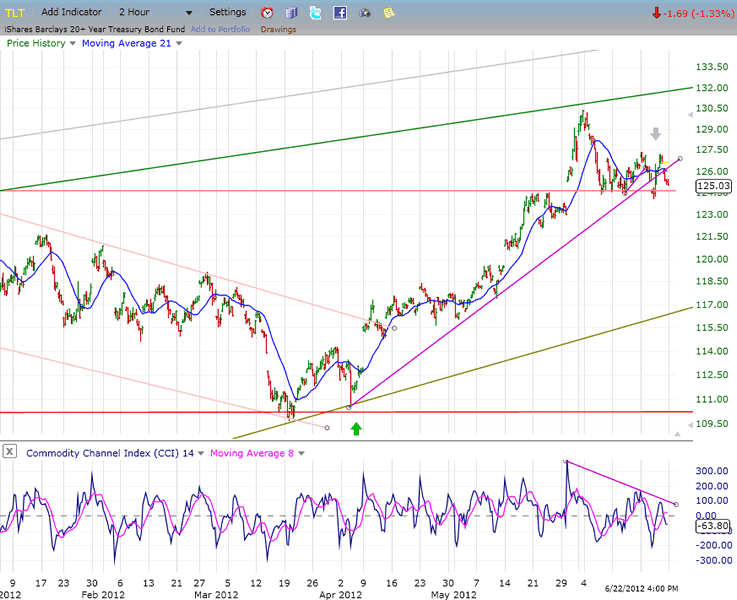
BONDS
TLT had a good rally while the market was correcting, and found a short-term top when the SPX made a low in early June. Since then, it has formed a shallow consolidation pattern, finding support at the previous long-term top of 125. It did not confirm the move which SPX made to 1363, refusing to match the latter's uptrend with a downtrend of its own. Like XLF, its current predictive value seems to be very limited and reflects the present market uncertainty.
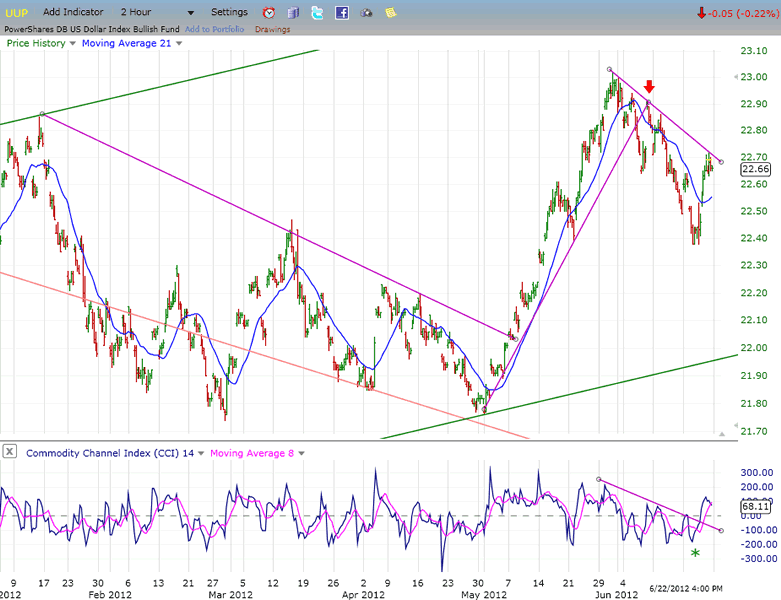
UUP (Dollar ETF) Daily Chart
UUP, by contrast, was very supportive of SPX, having a quick decline while the latter was rallying. It also rallied sharply when the SPX pulled back over the last two days. However, as you can see, its rally stopped at the short-term downtrend line and brought it at a decision point. If it pulls back, the market will probably go up. If it breaks through and continues its rally, the SPX should extend its decline.
UUP is actually a proxy for the Euro. What the Euro does, UUP will do in reverse. Since the Euro's next move will probably be decided by what comes out of next week's meeting, so will UUP's next move. The most logical trend for both indices would be sideways, waiting for news, and this could cause the SPX to do essentially the same.
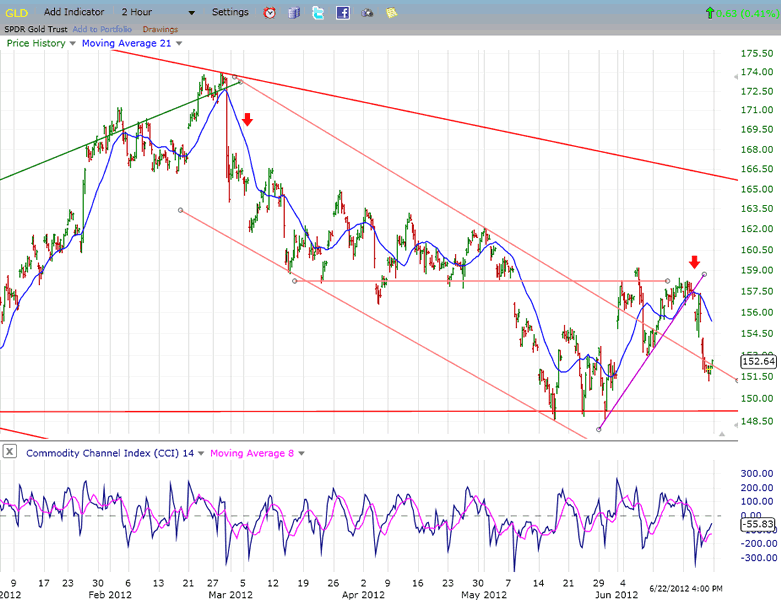
GLD (ETF for gold)
GLD remains in an intermediate downtrend. An attempt at breaking out of a secondary down channel was not entirely successful since its rally was stopped at the very bottom of the overhead resistance, and it was pushed back close to the former support level. It makes one wonder if GLD is anywhere close to ending its intermediate correction. We'll soon find out! Either the support level will hold, and we'll have another attempt at reversing the intermediate trend -- which is now over a year in duration and could qualify for "long-term" - or GLD will move below 149 and go on to meet its long-standing projection of 141.
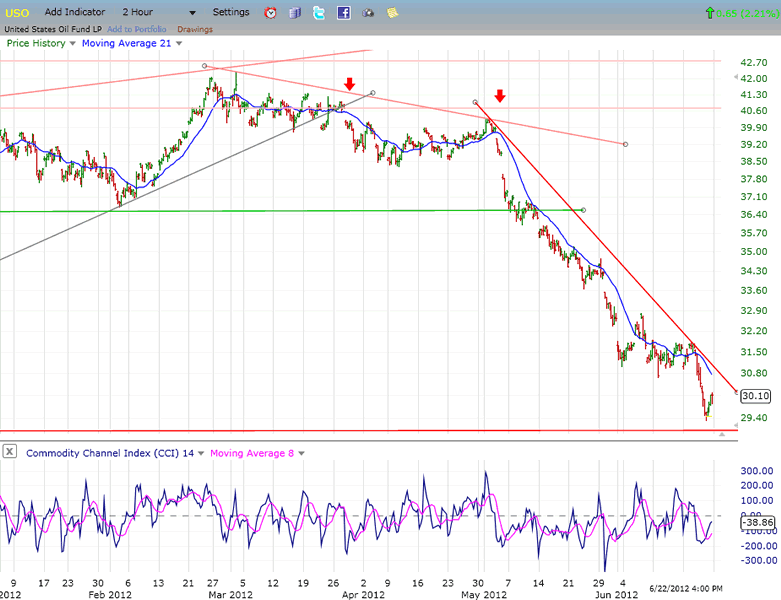
OIL(USO)
USO remains one of the weakest indices on the board. It's decline has not relented one bit and it makes one wonder if it is going to hold its 30-31 interim projection for much longer. On Friday, it came within 21 cents of challenging its October 2011 low, which is the lowest level since the 2009 low of 22.74. With this downside momentum behind it, it's unlikely that it will stop here for very long. At least, the decline in crude is having some beneficial repercussions in the price of gas.
Summary
The near-term direction of the stock market will, to some extent, depend on what is decided at the Euro summit scheduled for next Thursday and Friday.
The intermediate direction will be affected by whether or not the 2-yr cycle bottomed early at the beginning of June, or if it is still ahead of us. If the latter, we could be facing two or three more weeks of declining prices which would be a test for the 1267 level reached on that date.
FREE TRIAL SUBSCRIPTON
If precision in market timing for all time framesis something that you find important, you should
Consider taking a trial subscription to my service. It is free, and you will have four weeks to evaluate its worth. It embodies many years of research with the eventual goal of understanding as perfectly as possible how the market functions. I believe that I have achieved this goal.
For a FREE 4-week trial, Send an email to: ajg@cybertrails.com
For further subscription options, payment plans, and for important general information, I encourage
you to visit my website at www.marketurningpoints.com. It contains summaries of my background, my
investment and trading strategies, and my unique method of intra-day communication with
subscribers. I have also started an archive of former newsletters so that you can not only evaluate past performance, but also be aware of the increasing accuracy of forecasts.
Disclaimer - The above comments about the financial markets are based purely on what I consider to be sound technical analysis principles uncompromised by fundamental considerations. They represent my own opinion and are not meant to be construed as trading or investment advice, but are offered as an analytical point of view which might be of interest to those who follow stock market cycles and technical analysis.
Andre Gratian Archive |
© 2005-2022 http://www.MarketOracle.co.uk - The Market Oracle is a FREE Daily Financial Markets Analysis & Forecasting online publication.