


U.S Gold Net Exports Increased Substantially During First Quarter 2012
Commodities / Gold and Silver 2012 Jul 06, 2012 - 03:36 AM GMTBy: Steve_St_Angelo

 Something very interesting took place in the first three months of 2012. Last year, the United States was a net importer of gold during the first quarter. However this year, the U.S. became a huge net exporter of gold during the same time period. This information was acquired from the latest USGS Gold Mineral Industry Surveys.
Below, we can see the actual data:
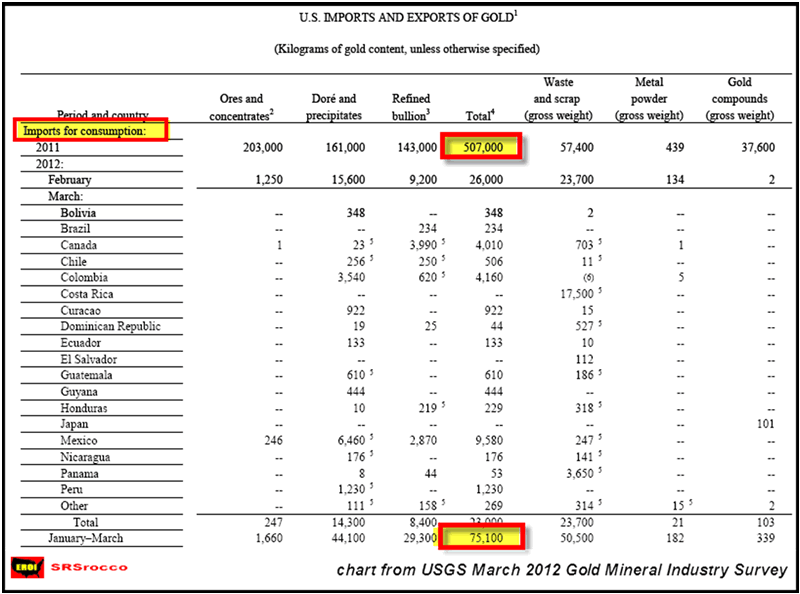
I have focused on the first three categories as these are the predominant sources used in the gold bullion trade. This first chart lists the amount of gold imported during the first quarter of 2012. If we look at the bottom highlighted figure we will see that 75.1 metric tonnes of gold were imported into the U.S. between January and March (These figures are listed in kilograms). The top highlighted figure (507 metric tonnes) shows the total amount of gold imported in 2011.
The chart below displays the amount of U.S. gold exported during Jan-Mar:
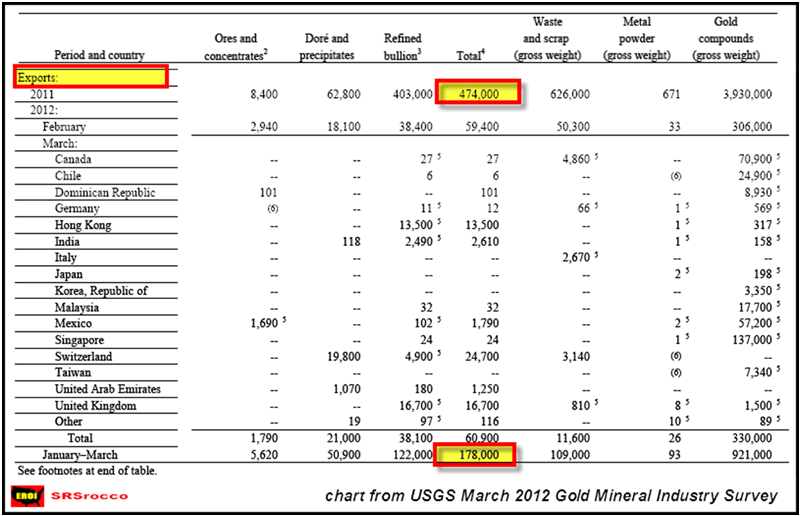
Here we can see that during the first three months of 2012, the U.S. imported only 75.1 metric tonnes, but exported 178 metric tonnes. Thus, the United States was a net exporter of 103 metric tonnes of gold during the first quarter of 2012.
The reason why this is interesting is due to the fact the U.S. was a net importer of 38 metric tonnes of gold during the same time period last year. The next chart reveals just how much gold is leaving the U.S. continent.
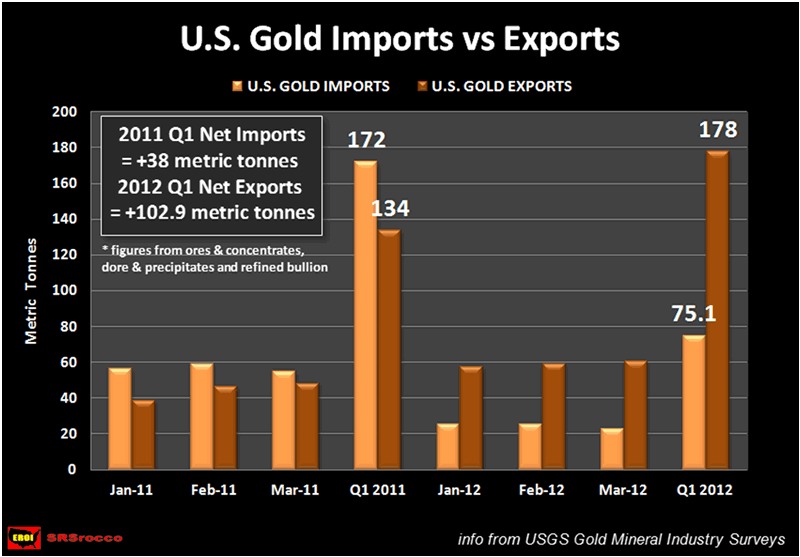
What a difference in a year – the tide has indeed changed. This turns out to be a net export difference of 141 metric tonnes of U.S. gold compared to last year – or 4.53 million ounces of gold in just three months. When the USGS releases the next Gold Mineral Industry Survey, it will be interesting to see how much more gold is leaving the country. Not only is gold leaving the continent, look at the drop of gold imports during this time period.
U.S. Gold Imports
Q1 2011 = 172 metric tonnes (MT)
Q1 2012 = 75.1 metric tonnes (difference of 97 MT)
So where is all this gold going? That’s a good question. If you look up at the Gold Export chart above, you will notice that top three countries receiving U.S. gold were Hong Kong, the United Kingdom, and Switzerland.
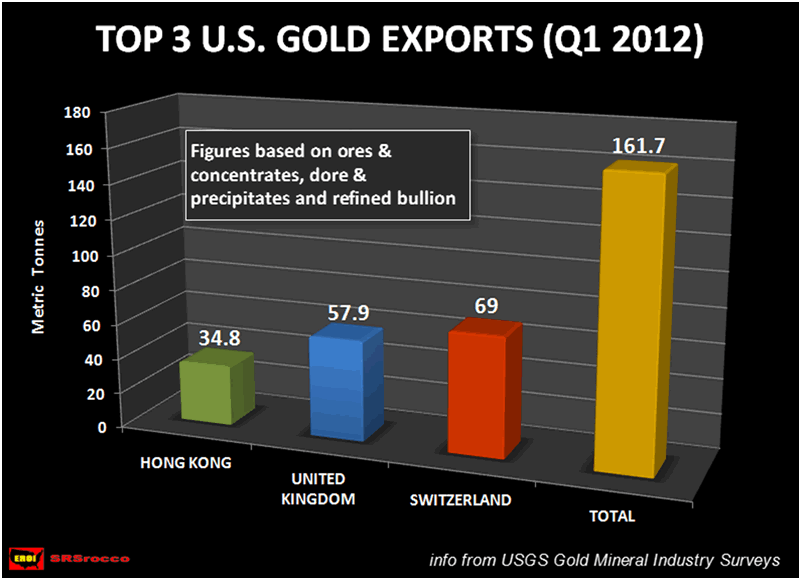
Of the total 178 metric tonnes of gold exported from the U.S. during Q1 of 2012, Hong Kong, the United Kingdom and Switzerland acquired 161.7 metric tonnes or 91% of the total amount. If the rumors are correct, the majority of this gold is being shipped to these countries and being purchased by the Big Eastern Buyers.
Of course this information is from a U.S. governmental agency and it can’t be a guarantee of complete data, but at least this gives us a good idea how the situation has changed from the prior year.
RETAIL INVESTMENT DEMAND IS A MERE PITTANCE
As I have mentioned before, retail investment demand is not a good barometer for the precious metal market. If the figures are correct, the U.S. had net exports of 103 metric tonnes (3.3 million ounces) of gold during the first three months of 2012. If we look at the chart below, we can see how little Gold Eagles sales are compared to overall U.S. gold exports:
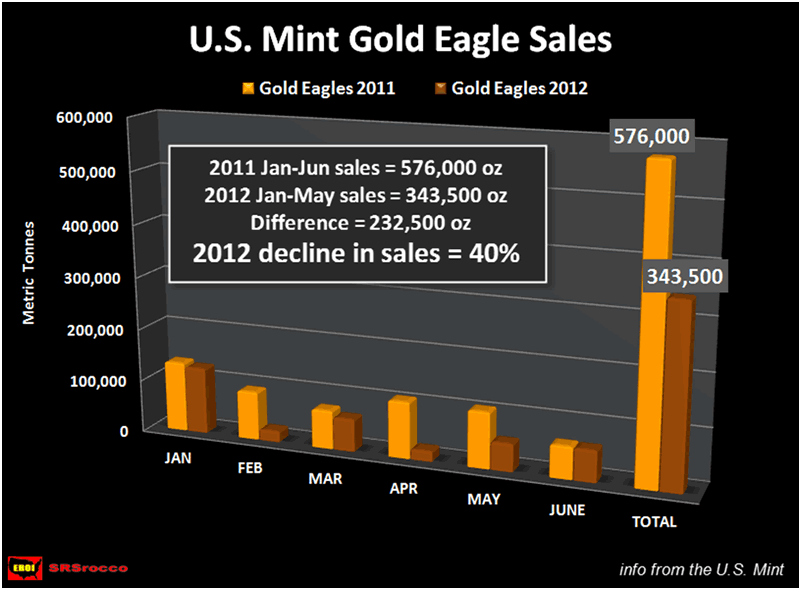
Gold Eagle sales in the first half of the year were 343,500 ounces (down 40% yoy), while U.S. gold net exports were over 3.3 million ounces from Jan-Mar 2012. If this trend of U.S. gold exports continues, half year figures could reach 5-6 million ounces. This would mean that retail Gold Eagle demand may only account for 6-7% of the forecasted 5-6 million ounces of U.S. gold net exports.
This proves the case that the majority of Americans are still quite clueless when it comes to understanding gold’s role as money. As the world financial system continues to crumble, the large Eastern buyers and a small minority of Europeans are rapidly exchanging fiat paper notes for gold.
At some point in time the GAME OF MUSIC GOLD CHAIRS will end and the public may not have the opportunity to buy physical gold…. even if they had the means to do so.
GOT GOLD??
Steve St .Angelo Independent researcher residing in southwest Utah
Contact SRSrocco@gmail.com
© 2012 Copyright Steve St .Angelo - All Rights Reserved Disclaimer: The above is a matter of opinion provided for general information purposes only and is not intended as investment advice. Information and analysis above are derived from sources and utilising methods believed to be reliable, but we cannot accept responsibility for any losses you may incur as a result of this analysis. Individuals should consult with their personal financial advisors.
© 2005-2022 http://www.MarketOracle.co.uk - The Market Oracle is a FREE Daily Financial Markets Analysis & Forecasting online publication.