


Gold Bullish, But Gold Stocks Showing Bearish Divergence
Commodities / Gold & Silver Feb 10, 2008 - 03:58 AM GMTBy: Merv_Burak

Up and down but in the end gold seems to be having trouble moving. Does it have anything to do with the recent strengthening in the U.S. Dollar Index?
GOLD : LONG TERM
From a long term perspective there is no real serious problem with gold. The indicators change very slowly so one does not expect sudden changes in the technical situation. Gold continues to trade well above its long term moving average line and the line continues to trend upwards. The long term momentum (price strength) indicator is also well inside its positive zone with no hint of a reversal in site. It recently moved into new highs confirming the strength of the recent gold price action. The volume indicator (an indication of speculative interest) continues above its long term trigger line and the trigger continues to point upward. The only cautionary signs are in the more aggressive time periods which will be reviewed below.
The last time I showed the long term P&F chart was in the 28 Dec 2007 commentary. At that time I mentioned projections based upon the long term P&F chart to the $915 level and then to the $1125 level. Well, the $915 has been filled so now on to the $1125 level. The subsequent action in this long term P&F chart has given me a new intermediate level, to the $1020 level so I guess it's on to $1020 and then $1125. There is a long standing very long term projection to the $1600 level but that's some distance away and not of much interest yet.
The long term rating for gold remains BULLISH .
INTERMEDIATE TERM
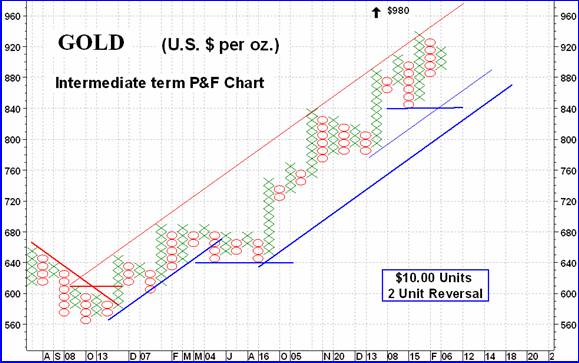
Looking at the intermediate term P&F chart, since October of 2006 the gold price has been on a steady climb with only some rest periods along the way. Although it gave us a scare once or twice along the way it had not given the two signals that I require for a reversal of trend, those being a break below the up trend line and a move below the previous two lows. Its latest move, which started last December, has given us an intermediate term projection to $980. That gives us three projections that are within grasp. The more projections I can calculate the more likely one is going to pan out. From the action to the Friday close it would take a move to the $840 level before we might get an intermediate term P&F reversal, but most likely there would be further up and down action which would upgrade the reversal point higher.
Looking at the intermediate term chart and indicators, almost all is still well. There are some warning signs but as I often caution, these are only warnings and not an indication of an eventual trend reversal. Gold continues to trade above its positive sloping moving average line and the momentum indicator remains in its positive zone. The momentum indicator, which in my view is an indication of the strength of recent price action, is showing weakness versus its momentum reading during the early November high. In addition, during this week's reaction low the momentum indicator made a lower low versus its low from mid-January. The price reaction low this week was at a considerably higher low than its January low. The volume indicator, although still below its previous high in November, is continuing to track above its positive sloping intermediate term trigger line. It is, however, showing signs of weakness and may drop below its trigger line unless the daily volume action improves.
All in all there is still no reason for down grading the intermediate term rating, it remains BULLISH .
SHORT TERM
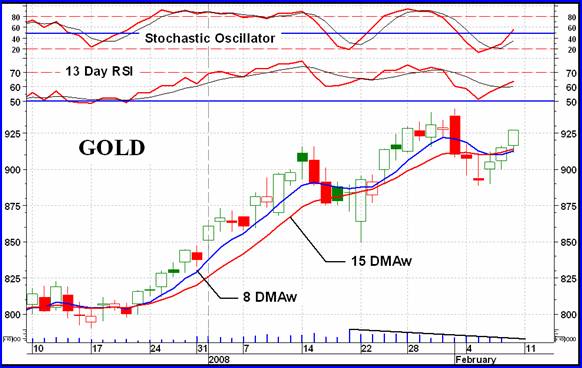
Despite the drop earlier in the week with the short term moving average (15 DMAw) turning downward the short term momentum remained in its positive zone and is once more on the advance, as is the price of gold. The more aggressive Stochastic Oscillator did move into its negative zone and into its oversold zone before rebounding. It is once more in its positive zone. Both moving averages, the short term and the very short term (8 DMAw) have reversed back to the up side although the more aggressive moving average is still a shade below the short term one. One more day of upside and it will be above the short term average. As of Friday close the short term is rated as BULLISH and the immediate term direction remains upwards. One can clearly see the reduction in volume activity suggesting speculators staying out of the recent action. We need them back for the gold price to continue higher, or else the price will reverse.
NORTH AMERICAN GOLD INDICES
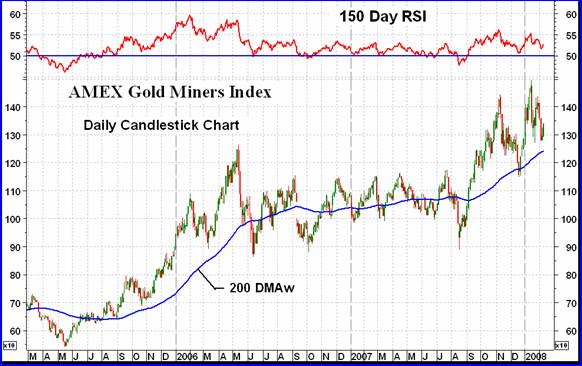
This week's major North American Index is the AMEX Gold Miners Index. I thought I'd look in on a long term chart with a long term momentum (150 Day RSI). Since going long term bullish in mid-2005 by a move above the moving average and with the momentum going positive everything has been great with the exception of two short periods when we got a bear signal that was, in both cases, quickly reversed. Those were in late Sept of 2006 and August of 2007. The Index remains above a positive long term moving average line and the momentum indicator remains in its positive zone. But for how long?
Of note on the chart are two negative divergences, one in early 2006 and the other one at this time. The first negative divergence resulted in a year and a half lateral period which included those two brief bearish signals. The present divergence has not yet run its course. These two diverging peaks, one in January and the other in November, are themselves divergences versus the peaks in early 2006. The latest peaks are starting from a much lower level than the earlier peaks and therefore have a better chance of developing into a bearish trend. One will just have to wait and see how this develops.
MERV'S PRECIOUS METALS INDICES
It's an interesting difference of opinion between the speculators in stocks and speculators in bullion. While the gold and silver bullion gained on the week ALL of the gold Indices declined. There is an old theme that the stocks move in advance of the bullion. If this is so then we may be seeing bullion prices come down in the not too distant future. How far down is the question.
Despite the negativity in the stocks, and the decline in the Merv's Composite Index of Precious Metals Indices this past week, the Composite is still in a positive mode with the Index above its moving average lines and both the intermediate and long term averages pointing upward. Both momentum indicators are still in their positive zones so from a technical standpoint one would still be BULLISH on the overall precious metals. However, things are becoming less positive and a reversal just might be ahead.
MERV'S GOLD & SILVER 160 INDEX
The average loss for the 160 component stocks in this Index was 1.3% during the week. Most Indices had made new highs during these past few weeks but this universe did not. It was being held back by the more speculative components in the universe. Of the 160 stocks in the Index one third advanced during the week while two thirds declined. The single largest gainer was QGX Ltd. with a gain of 26.5% while the largest single loser was Eaglecrest Exploration with a loss of 15.8%. As far as the summation of individual stock ratings are concerned, they stand as follows: short term BEAR 63%, intermediate term BEAR 59% and long term BEAR 50%. I primarily follow the intermediate term trends. For the universe, I rate the stocks for all three time periods but provide my subscribers with a list of stocks whose primary (BULL or BEAR) rating has changed from one to the other. It's instructive to see how these 160 stocks stand as to what their latest primary ratings are. They stands at BULL 39% and BEAR 61%. This is just another indicator that tells us we are in an intermediate term bear market as far as these 160 gold and silver stocks are concerned. One would therefore be very cautious about investing until this intermediate term rating moves into the BULL 50% or greater area.
As for the charts and indicators, on the long term the Index is below its negative sloping moving average line and the momentum indicator has just crossed ever so little into the negative zone. The long term is rated as BEARISH . As for the intermediate term it's the same story for a BEARISH rating.
SLIMING DOWN
Due to an increase in work load I will be reducing the content of these commentaries for awhile. I'm not yet sure how I will reduce it but most likely the North American and Merv's Indices sections will be slimed down considerably, as well as the Silver section. The gold analysis, which is the primary commentary, will remain untouched. I will have a better idea next week, which should include the changes.
Merv's Precious Metals Indices Table
That's it for now.
By Merv Burak, CMT
Hudson Aero/Systems Inc.
Technical Information Group
for Merv's Precious Metals Central
Web: www.themarkettraders.com
e-mail: merv@themarkettraders.com
Before you invest, Always check your market tirming with a Qualified Professional Market Technician
For DAILY Uranium stock commentary and WEEKLY Uranium market update check out my new Technically Uranium with Merv blog at www.techuranium.blogspot.com .
During the day Merv practices his engineering profession as a Consulting Aerospace Engineer. Once the sun goes down and night descends upon the earth Merv dons his other hat as a Chartered Market Technician ( CMT ) and tries to decipher what's going on in the securities markets. As an underground surveyor in the gold mines of Canada 's Northwest Territories in his youth, Merv has a soft spot for the gold industry and has developed several Gold Indices reflecting different aspects of the industry. As a basically lazy individual Merv's driving focus is to KEEP IT SIMPLE .
To find out more about Merv's various Gold Indices and component stocks, please visit www.themarkettraders.com and click on Merv's Precious Metals Central . There you will find samples of the Indices and their component stocks plus other publications of interest to gold investors. While at the themarkettraders.com web site please take the time to check out the Energy Central site and the various Merv's Energy Tables for the most comprehensive survey of energy stocks on the internet. Before you invest, Always check your market timing with a Qualified Professional Market Technician
Merv Burak Archive |
© 2005-2022 http://www.MarketOracle.co.uk - The Market Oracle is a FREE Daily Financial Markets Analysis & Forecasting online publication.