


Gold US Dollar Link in Question, Technical Setup
Commodities / Gold and Silver 2012 Oct 22, 2012 - 04:44 PM GMTBy: Chris_Vermeulen

 The $1800 per ounce level continues to be a major technical resistance area for gold. After hovering near $1800 recently, gold moved sharply away from that level last week to close at $1735 an ounce.
Despite that, more fund managers and analysts continue to point to a bright long-term future for gold prices. John Hathaway of the Tocqueville Gold Fund says gold will reach new highs within a year. He based his forecast, like many others, on the fact that negative real interest rates look likely to persist as Ben Bernanke and the Federal Reserve continue to print money.
Believe it or not, some mainstream analysts are also touting gold’s potential. Merrill Lynch analysts point to the correlation (discussed in a previous article) between the price of gold and the expansion of the Federal Reserve’s balance sheet since the start of QE1 in early 2009.
Based on the current path of the Fed’s balance sheet expansion, Merrill Lynch came up with two longer-term targets for the price of gold. They project gold to hit $2,000 an ounce next summer and to hit $2,400 an ounce by the end of 2014.
Another way to look at gold and the Fed is the so-called gold coverage ratio. That is the amount of gold on deposit at the Federal Reserve versus the total money supply. According to Guggenheim Partners, the gold coverage ratio is at an all-time low of 17%. The historical average is about 40%, meaning that gold would to more than double to reach the average.
Looking at the Fed’s balance sheet is a new and interesting way to look at and forecast gold prices. In the past, the conventional wisdom was that gold was merely an anti-dollar play: U.S. dollar down, gold up and vice versa. But that seems to be changing…..
Reuters had some interesting data. The value of the U.S. dollar net short position fell to $6.43 billion for the week ended October 9. This is substantially down from the previous week’s net short position of $16.3 billion. At the same time, the “managed money” net long gold position in gold futures rose to its highest level since August 2011. That was the time when gold hit its record high of $1,920 an ounce.
So much for conventional wisdom. Both currency and gold traders are seeing this long-term relationship between gold and the U.S. dollar breaking down into a “new normal” of direct central bank intervention into financial markets. Gold seems increasingly to be turning into more of a safe haven play than an anti-dollar one. It seems that more investors are worried about all fiat currencies that are burdened by huge debt loads.
The Technical Take…
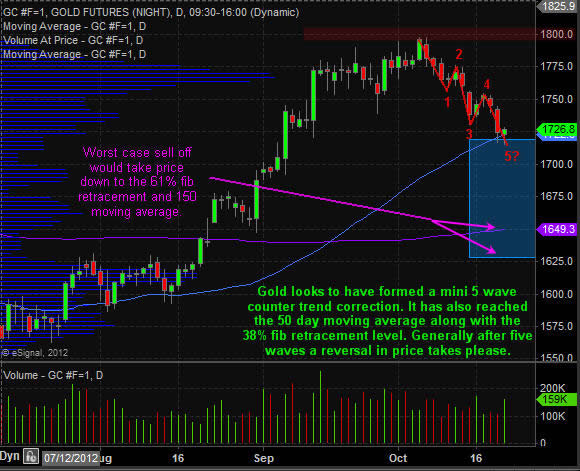
Below is a daily chart of gold futures. Looking at the price levels and analysis you can see that a bounce or bottom could form at any time now. Price of gold has pulled back in a mini five wave correction touching both our first Fibonacci retracement level of 38% and the 50 day simple moving average. This is the type of pullback that longer term investors like to add to their long gold position. While gold does have the potential to fall all the way down to $1625, in the long run it should continue to rise for the long term investor.
From a trader point of view, it may be worth a stab to get long gold with a very tight stop, but until we see a real panic selling day in gold where volume is high I don’t think the final bottom is in yet.
If you would like to learn more about trading and get my trading alerts visit
By Chris Vermeulen
Please visit my website for more information. http://www.TheGoldAndOilGuy.com
Chris Vermeulen is Founder of the popular trading site TheGoldAndOilGuy.com. There he shares his highly successful, low-risk trading method. For 7 years Chris has been a leader in teaching others to skillfully trade in gold, oil, and silver in both bull and bear markets. Subscribers to his service depend on Chris' uniquely consistent investment opportunities that carry exceptionally low risk and high return.
This article is intended solely for information purposes. The opinions are those of the author only. Please conduct further research and consult your financial advisor before making any investment/trading decision. No responsibility can be accepted for losses that may result as a consequence of trading on the basis of this analysis.
© 2005-2022 http://www.MarketOracle.co.uk - The Market Oracle is a FREE Daily Financial Markets Analysis & Forecasting online publication.