


U.S. Stock Market Inflection Point
Stock-Markets / Stock Markets 2012 Nov 19, 2012 - 09:29 AM GMTBy: Tony_Caldaro

 For the bears it was a good week. With the exception of monday’s lightly traded semi-holiday session, the market made a new downtrend low every day. For the week the SPX/DOW were -1.75%, and the NDX/NAZ were -1.85%. Asian markets lost 1.2%, European markets lost 2.2%, and the DJ World index was -1.9%. On the economic front it was not much better. For the first time in many weeks the economic reports were predominately negative, with 8 to 3 to the downside. On the uptick: business inventories. the monetary base, and the CPI. On the downtick: retail sales, the PPI, the NY/Philly FED, industrial production, the WLEI, plus both the budget deficit and weekly jobless claims rose. Next week, another light economic report ahead of thursday’s Thanksgiving holiday, we’ll get reports on Consumer sentiment, the Leading indicators and Housing. Best to your Holiday!
LONG TERM: bull market
Despite the markets seemingly relentless decline since the Election, this correction continues to look quite normal for this stage of the wave structure. It has declined somewhat more than we recently expected as the SPX hit, our worse case support scenario, SPX 1345/46 on friday.
On wednesday we raised the probability for our alternate bearish count from 20% to 30%. Remaining objective we would like to review both of these bullish and bearish counts, as the market has reached another inflection point. They seem to occur every year now.
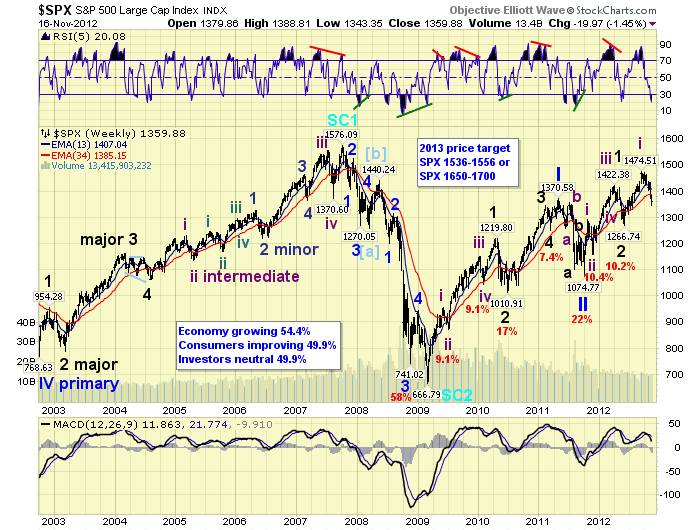
Our preferred bullish count remains unchanged. We have been expecting a five Primary wave bull market into 2013. Primary waves I and II completed in 2011, and Primary wave III has been underway since then. Primary I divided into five Major waves, with a subdividing Major wave 1. Primary III also divided into five Major waves, but now both Major 1 and Major 3 appear to be subdividing. When this correction concludes, Intermediate wave iii of Major wave 3 should be underway, to new bull market highs.
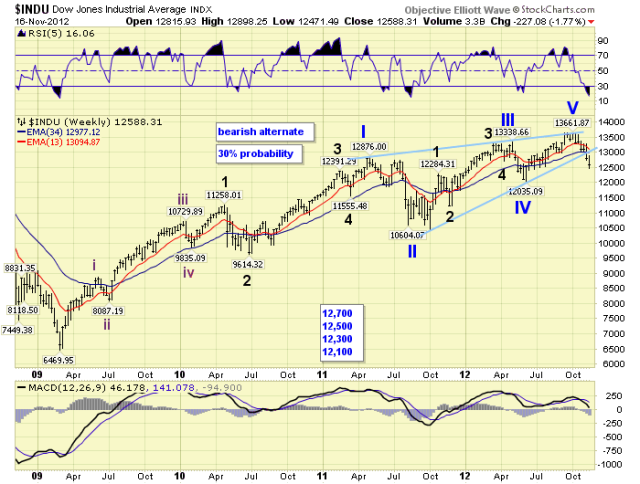
Our alternate bearish count, first posted last weekend, suggests the bull market ended at the recent DOW 13,662 high (SPX 1475) in the form of an elongated diagonal triangle. The five Primary waves expected, unfolded in an overlapping fashion forming a rising wedge. Should this be the effective pattern, the market should lose about 50% of its value over the next few years. We noted four levels of importance on the DOW chart: 12,700, 12,500, 12,300 and 12,100. As each level is hit the probabilities of this count rises accordingly: 12,700 was 20%, 12,500 is now 30%, etc.
While the bullish count suggests this is now a buying opportunity. The bearish alternate count suggests one shouldn’t be in the equity market at all. Confusing right? We will now approach this inflection point objectively so that you can make your own investment decisions.
The initial downtrend of the last five bear markets, going back three decades, has displayed a market decline between 6.9% and 13.8% with the mean at 10.8%. After this downtrend an uptrend has always followed that has retraced between 69% and 90% of the downtrend, with the mean at 75%. Then, the next downtrend resumes the bear market. Reviewing the current bull market structure which has contained only Intermediate, Major and Primary waves. When this Int. wave ii downtrend concludes the next uptrend, Int. wave iii, must make new highs. It can not fall short, as a 69% to 90% retracement, and subdivide into a wave of a lesser degree. Major wave 3 of Primary I did not subdivide at all. Therefore we see no reason for Major wave 3 of Primary III to subdivide any further than it already has.
What does this all mean? When this downtrend ends, there will likely be at least a 69% retracement of the entire decline. If this upcoming uptrend fails to make new highs we are very likely in a new bear market. If it makes new highs the bull market resumes with the preferred count. The next uptrend will be the key to the entire bull/bear inflection point. Let’s see what the market decides in the coming weeks/months.
MEDIUM TERM: downtrend hits SPX 1343
The current downtrend, we have been labeling Intermediate wave ii, has now declined 8.9% from the bull market high of SPX 1475. Previous Int. wave ii corrections, during this bull market, have declined between 9.1% and 10.4%. This also happens to be the mean range for all corrections during this bull market.
Currently we have a rare ‘quite’ oversold condition on the weekly chart with an MACD still above the bullish neutral. The daily chart is displaying a near ‘extreme’ oversold condition, and the hourly chart is displaying a positive divergence. These technical readings have been signs of an pending downtrend low during this bull market.
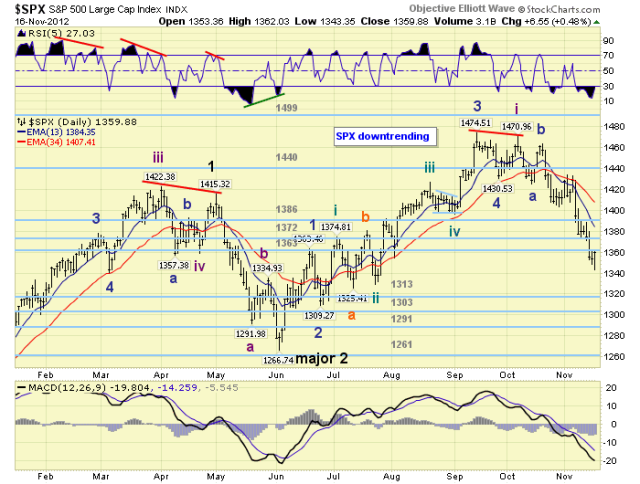
We have been counting the wave structure of this downtrend as a double three. The first three wave decline ended at SPX 1426 and we labeled it Minor A. After a Minor B wave rally to SPX 1464, another three wave decline began for Minor C. When Minor wave C first began we noted some fibonacci/retracement support levels. At the OEW 1386 pivot there was 38.2% retracement of the previous uptrend, and Minor C = 1.618 Minor A. At the OEW 1363 pivot there was a 50.0% retracement. Then our worse case scenario was SPX 1345/46 which represents a 61.8% retracement, and Minor C = 2.618 Minor A. This last fibonacci/retracement support level was hit on friday when the SPX reached 1343. This is also very close to the SPX 1341 level, which would be a 9.1% decline. The next medium term support would be at the OEW 1313 pivot, (which would be close to a 10.4% decline), and the 1303 pivot, with resistance at the 1363 and 1372 pivot.
SHORT TERM
Short term support is at SPX 1342/47 and 1333/38, with resistance at the 1363 and 1372 pivots. Short term momentum is rising off a recent positive divergence. The short term OEW charts remain negative since SPX 1416, with the swing level now at 1375.
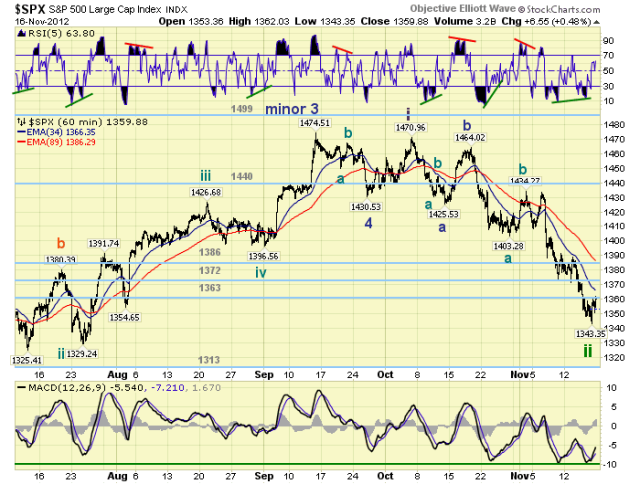
A closer look at Minor wave C displays a five wave Minute wave A decline to SPX 1403. Then an abc Minute wave B rally to SPX 1434, followed by another five wave decline which may have ended on friday at SPX 1343. At this level Minute C = 1.5 Minute A. We have also noted during Minute wave C each notable wave made a lower high and lower low until SPX 1343 was hit on friday. Then, at least for the short term, the trend reversed to higher highs and a higher low. The last time this occurred was during the Minute B wave rally. But it also occurs at the beginning of new uptrends.
Remaining objective, the next positive sign will occur when the short term OEW charts turn positive again. Currently this will require a rally above SPX 1375. Then we should get an all clear for a new uptrend when the SPX crosses 1400. With the hourly chart displaying an extremely oversold MACD double bottom, and a RSI positive divergence, there is a good possibility that friday’s low could have been the end of the downtrend. Best to your trading!
FOREIGN MARKETS
The Asian markets were mixed on the week for a net loss of 1.2%. Hong Kong and Indonesia remain in uptrends, and Japan is close to confirming one as well.
The European markets were all lower on the week for a new loss of 2.2%. Only Greece remains in an uptrend.
The Commodity equity group were all lower on the week for a net loss of 2.5%. All three indices are downtrending.
The DJ World index is downtrending and lost 1.9% on the week.
COMMODITIES
Bonds remain in a choppy uptrend gaining 0.2% on the week. The 10YR rate has declined from 1.89% to 1.57% on friday.
Crude is trying to establish an uptrend off a positive divergence and gained 1.2% on the week.
Gold is also trying to establish an uptrend but lost 1.0% on the week.
The USD is still uptrending, starting to get overbought, and gained 0.3% on the week. The EUR also gained 0.3%, while the JPYUSD dropped 2.3%.
NEXT WEEK
Monday kicks off this holiday shortened week with Existing home sales and the NAHB at 10:00. On tuesday: Housing starts and Building permits. Then on wednesday: weekly Jobless claims, Consumer sentiment and Leading indicators. Thursday is the Thanksgiving holiday and on friday volume will be quite light. FED chairman Bernanke gives speech on tuesday, at noon, in NYC. This is quite unusual for the FED to be giving speeches during a holiday week. It might be an important one. Best to your weekend, week and holiday.
CHARTS: http://stockcharts.com/...
http://caldaroew.spaces.live.com
After about 40 years of investing in the markets one learns that the markets are constantly changing, not only in price, but in what drives the markets. In the 1960s, the Nifty Fifty were the leaders of the stock market. In the 1970s, stock selection using Technical Analysis was important, as the market stayed with a trading range for the entire decade. In the 1980s, the market finally broke out of it doldrums, as the DOW broke through 1100 in 1982, and launched the greatest bull market on record.
Sharing is an important aspect of a life. Over 100 people have joined our group, from all walks of life, covering twenty three countries across the globe. It's been the most fun I have ever had in the market. Sharing uncommon knowledge, with investors. In hope of aiding them in finding their financial independence.
Copyright © 2012 Tony Caldaro - All Rights Reserved Disclaimer: The above is a matter of opinion provided for general information purposes only and is not intended as investment advice. Information and analysis above are derived from sources and utilising methods believed to be reliable, but we cannot accept responsibility for any losses you may incur as a result of this analysis. Individuals should consult with their personal financial advisors.
© 2005-2022 http://www.MarketOracle.co.uk - The Market Oracle is a FREE Daily Financial Markets Analysis & Forecasting online publication.