


Stock Market Fireworks Early 2013
Stock-Markets / Stock Markets 2013 Dec 24, 2012 - 04:56 AM GMT

 3 Down 2 More to Go! - I have been following a number of markets since late September, and I have been looking for new highs and price to exceed those highs made on September 2012. Early this week 2 of those markets took out and surpassed the prior September highs, the NYSE and XLF making those new highs confirmed my original thoughts that the decline from the September high was a clear 3 wave decline, which I have maintained only to the cries of the bears telling me it is the start of some gigantic market crash.
Well the DAX made a new yearly high as did other European markets earlier in the month, now we have the XLF and the NYSE making new highs above the September 2012 high. So the bears that were counting those markets as topped in September have got that completely wrong, which does not surprise me at all considering they are not respecting what price is suggesting.
Why did they get it wrong? Well its simple, it was a 3 wave decline, NOT a 5 wave decline as some Elliotticians tried to count it.
Why is this important?
Well a 3 wave decline in an uptrend is a corrective pullback and should see new highs as we have seen this week on the NYSE and XLF, I have been a working a theme with many markets and patterns and it seems we are only pieces away from a full set. The DOW and the SPX have yet to exceed their respective September highs, so whilst the market is not showing signs of a strong reversal, I am going to continue to give the benefit to the bulls, to run the market higher and take out the buy stops that will be sitting at those highs. Not only would it complete some ideas I am working with, but it will also likely turn the majority of traders and the media bullish at precisely the wrong time.
Just the way I like it. Trader’s getting mega bullish at the highs, like they were at the highs in 2010, 2011 & 2012
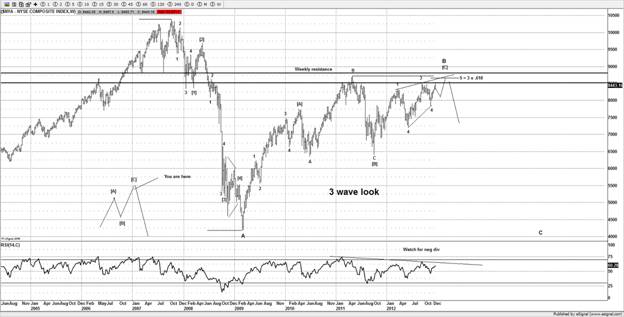
NYSE
This market can stretch a bit higher, which would help my ideas of seeing the DOW and SPX see that new price high above the September 2012 high, which would complete their ideas. It’s only just touching the target zone, so a bit more inside would setup up nicely as there is also a strong area of resistance just above that should pose as significant resistance, around 8665-8800.
Non Elliotticians can see the basic bearish wedge shape and the lack of strength to make a new high with a new price highs suggests that the market is in a topping phase, and if my main wave count is correct as shown we are setting up for a large move lower soon, although I still ideally want to see the DOW and SPX exceed their respective September 2012 high first.
Target is a test of the March 2009 lows round 4000.
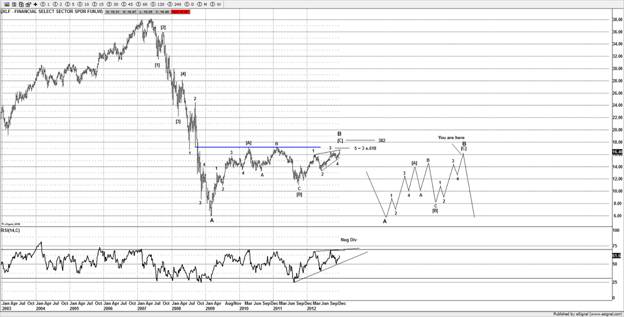
XLF
From the March 2009 lows you can clearly see a similar pattern to the NYSE and a 3 wave move, furthermore the last few months we appear to be making an ending diagonal for wave [C] of a larger B wave. (large bearish looking wedge)
With the new high made this week, that ticked this market as technically completed, although if the other main markets run a bit higher and I get to see the SPX around 1480SPX I suspect this could run a little bit higher towards the strong resistance area around the blue line at $17.17.
With the large RSI divergence showing, I still favor this as being inside an ending diagonal, so once the markets are ready and setup, I favor a strong reversal potentially sometime early in 2013.
It will need something serious on the upside to negate the patterns, and a serious new wave of buyers to enter the market. What I have seen so far is a trend that looks like its losing momentum and appears to be trying to make an important top.
Which all fits in with my ideas of a significant top setting up, based on the 3 wave moves from the March 2009 lows.
If you recall in my last article I wrote that we can watch the key financial stocks of the XLF such as JPM, BAC and GS for a timing of the XLF as well as the SPX, those stocks are important as the technician that is one step of those stocks will be closer to predicting a turn just as I did at the April 2012 highs.
It is my belief that the markets appear to be setting up for a large reversal early in 2013, and potentially a major top. Although a few markets are lacking that bit higher in price, but there are strong clues as well as pieces of the larger jigsaw puzzle appearing to come together.
SPX
I am still expecting this market to put in a move towards 1480SPX, although there is always the chance of a truncation as it would not be the first time I have tried to pinch every single last piece of a wave pattern, only to see it fall short right at the end, but with the market still not showing a strong impulsive move to the downside I am going to give the benefit to the upside and continue looking for that test of 1480-1500SPX.
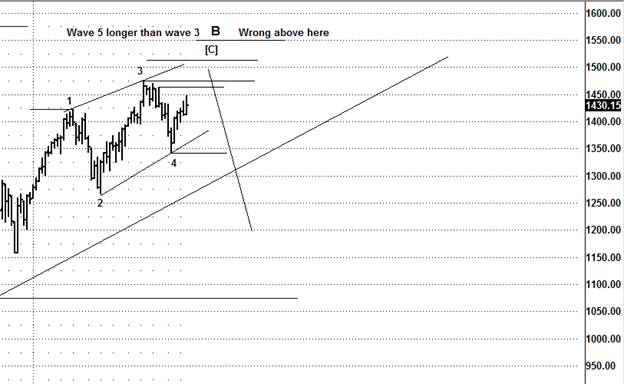
We have some key areas below, should they get violated I may just have to be forced to switch bias and accept the market failed to put in the new high, as many other markets have technically completed their respective patterns we are just waiting on the DOW and the SPX to join the party.
Conclusion
With the way the markets are setting up, it looks like early 2013 is going to be an explosive start, with many US and Asian markets setting up and hitting our long standing targets; I think we are ready for some fireworks.
Are you interested in joining our party? Interested in what we have to offer? Take the 4 week free trial, this week alone we nailed setups on Gold ,NDX, SPX and AUDUSD that would have made your yearly membership 3 times over.
But don’t take my word for it; come check us out if you think we are not the real deal. With a 4 week free trial, what are you waiting for?
I will leave it there for now and want wish all my members as well as readers of my articles a merry Christmas and happy New Year and see you in for 2013 for some fireworks.
Until next time
Have a profitable week ahead.
Click here to become a member
You can also follow us on twitter
What do we offer?
Short and long term analysis on US and European markets, various major FX pairs, commodities from Gold and silver to markets like natural gas.
Daily analysis on where I think the market is going with key support and resistance areas, we move and adjust as the market adjusts.
A chat room where members can discuss ideas with me or other members.
Members get to know who is moving the markets in the S&P pits*
*I have permission to post comments from the audio I hear from the S&P pits.
If you looking for quality analysis from someone that actually looks at multiple charts and works hard at providing members information to stay on the right side of the trends and making $$$, why not give the site a trial.
If any of the readers want to see this article in a PDF format.
Please send an e-mail to Enquires@wavepatterntraders.com
Please put in the header PDF, or make it known that you want to be added to the mailing list for any future articles.
Or if you have any questions about becoming a member, please use the email address above.
If you like what you see, or want to see more of my work, then please sign up for the 4 week trial.
This article is just a small portion of the markets I follow.
I cover many markets, from FX to US equities, right the way through to commodities.
If I have the data I am more than willing to offer requests to members.
Currently new members can sign up for a 4 week free trial to test drive the site, and see if my work can help in your trading and if it meets your requirements.
If you don't like what you see, then drop me an email within the 1st 4 weeks from when you join, and ask for a no questions refund.
You simply have nothing to lose.
By Jason Soni AKA Nouf
© 2012 Copyright Jason Soni AKA Nouf - All Rights Reserved
Disclaimer: The above is a matter of opinion provided for general information purposes only and is not intended as investment advice. Information and analysis above are derived from sources and utilising methods believed to be reliable, but we cannot accept responsibility for any losses you may incur as a result of this analysis. Individuals should consult with their personal financial advisors.
WavePatternTraders Archive |
© 2005-2022 http://www.MarketOracle.co.uk - The Market Oracle is a FREE Daily Financial Markets Analysis & Forecasting online publication.