


Signs of Stock Market Correction in the SPX, RUT & DJIA is Near
Stock-Markets / Stock Markets 2013 Jan 22, 2013 - 06:55 PM GMTBy: J_W_Jones

 The great market prognosticators have by now came out with their 2013 predictions about financial markets. It seems to me to be a fool’s game to try to predict what financial markets are going to do in the future.
I want to be clear in stating that I do not know what is going to happen in the future. I do not know where the S&P 500 Index is going to trade tomorrow let alone 6 months from now. Most market pundits simply will not admit to this fact.
These same market pundits seemingly are unable to be honest about their own fallibility. In their own mind they believe it undermines their credibility or will hurt their forward sales for some book or strategy they are going to unveil. I for one do not prescribe to that notion, I believe in telling the truth.
The truth is that these so-called market experts do not know anymore than you or I about price action in the distant future. However, what I do know is that forward price action remains a mystery until its unveiled in the present.
Instead of wasting time discussing potential price action in the future, why not focus on a few pieces of information that have occurred that are known facts right now. I think the chart below points out that in the intermediate time frame, equity indexes are reaching extreme overbought conditions.
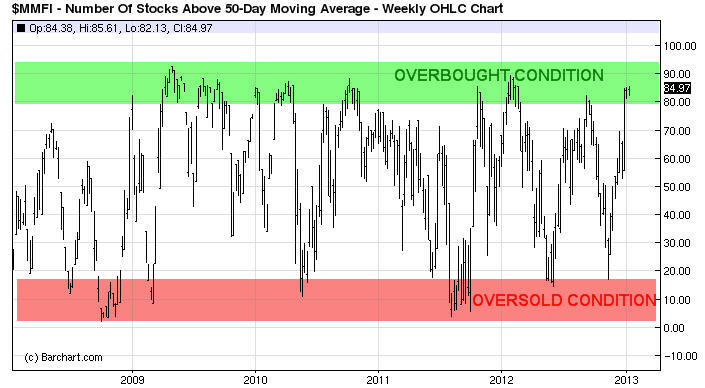
As can be seen above, the number of stocks trading above their 50 period moving averages is reaching close to the highest levels in the past 5 years. Many times when these price levels have been reached we witness a correction at the very least and any short-term gains are usually given back in short order. This is not to say that prices are going to sell-off tomorrow or in the next few weeks, however it is a warning that a correction is likely lurking in the not-so-distant future.
To help confirm this notion, a quick look at the Volatility Index (VIX) demonstrates just how much complacency there is in the short-term spot VIX price which is currently trading below 5 year lows. For novice readers when the VIX moves lower the outcome is typically bullish for the S&P 500 Index and when the VIX moves higher the reaction is typically bearish in terms of the S&P 500 Index.
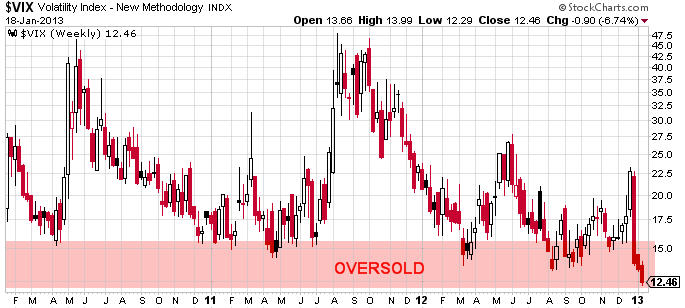
As can be seen above, the VIX is trading near the bottom of its recent range. This helps confirm the strength we have seen the past few weeks, however a reversal seems likely in the near future. Should the VIX pick up considerably it would have a negative impact on the S&P 500 Index. Furthermore, if we go out several months in time the Volatility Index Term Structure steepens wildly.
What this means is that traders and money managers have bid up forward VIX contracts in an attempt to hedge against a variety of perceived risk. I would also point out that at the moment February monthly options contracts are cheap relative to their historical volatility levels. However, the VIX could rally violently higher should the appropriate chain of events take place in the months ahead.
There are several catalysts in the short-term which will have a major impact on price action for the broader indexes. This coming week we will have earnings from major companies such as IBM, AAPL, and GOOG which all have the potential to move the tape significantly in either direction.
The other more obvious short-term inflection point is the dreaded U.S. debt ceiling debacle which is likely to begin permeating the financial media as the deadline for action draws near. In recent history both houses of Congress and the Executive Branch have struggled to achieve compromise until the 11th hour. The fiscal cliff was one issue, but the debt ceiling issue has the potential to have a major impact on financial markets.
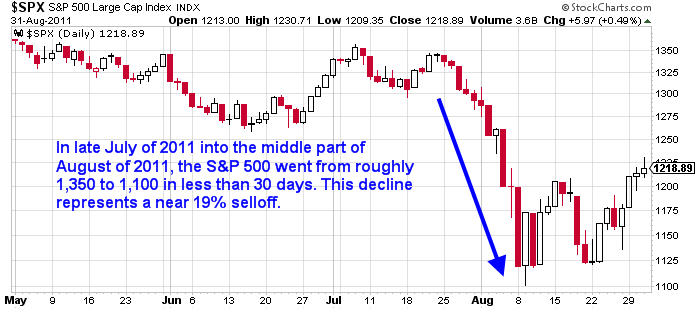
Just to put into context what happened back in 2011 when Congress could not reach a compromise regarding a debt ceiling increase, the S&P 500 Index had the following reaction as shown below.
Obviously there are significant unknowns regarding how the debt ceiling process will unfold in 2013. However, what is known is that should the politicians wait until the 11th hour equity indexes could force their hands yet again.
Additionally the threat of credit rating agencies downgrading U.S. government debt is a major concern. The outcome of this decision alone has the potential to devastate investment portfolios should the government have a partial shutdown as a result of a failure to reach an agreement regarding the debt ceiling.
What is important to understand is that the longer-term price action in the future is impossible to know at this point. We have major earnings reports which are about to be released over the next few weeks which presents significant risks to the broader indexes in both directions. Furthermore we have a major macro event that is facing us and will have to be addressed in the next 5 – 8 weeks.
The outcome of these events as this point is entirely unknown. I would also point out that in 2011 prior to the debt ceiling debacle we saw equity prices rally higher in late June of 2011 while the VIX traded down near recent lows at that time. After a period of consolidation equity indexes remained patient and gave the politicians time.
Eventually the price action in risk assets forced both political parties and the President to come together. As shown in the chart above, the S&P 500 lost nearly 19% in less than 4 weeks of trading sessions. Even the most skeptical politician was forced into submission by Wall Street and the financial media.
Will history rhyme with the recent past? Will we see a compromise in advance of the dreaded shutdown date? Will the debt ceiling outcome create a major paradigm shift in U.S. financial markets and U.S. politics?
Unfortunately, there is no one that can tell us with any certainty what is about to happen in the next 5 – 8 weeks, let alone later this year. After all of the forthcoming analysis and discussion in the weeks ahead, price action will continue to remain a mystery until the debt ceiling situation is behind us. Until then, caution is warranted in both price directions. Trade safe.
Risk-FREE 30-Day Trial
only $1 for the first 30 days!
JW Jones
www.TradersVideoPlaybook.com
J.W. Jones is an independent options trader using multiple forms of analysis to guide his option trading strategies. Jones has an extensive background in portfolio analysis and analytics as well as risk analysis. J.W. strives to reach traders that are missing opportunities trading options and commits to writing content which is not only educational, but entertaining as well. Regular readers will develop the knowledge and skills to trade options competently over time. Jones focuses on writing spreads in situations where risk is clearly defined and high potential returns can be realized.
This article is intended solely for information purposes. The opinions are those of the author only. Please conduct further research and consult your financial advisor before making any investment/trading decision. No responsibility can be accepted for losses that may result as a consequence of trading on the basis of this analysis.
J.W. Jones Archive |
© 2005-2022 http://www.MarketOracle.co.uk - The Market Oracle is a FREE Daily Financial Markets Analysis & Forecasting online publication.