


How to Profit from High Gasoline Prices
Commodities / Gas - Petrol Feb 28, 2013 - 04:22 PM GMTBy: Investment_U

 David Fessler writes: If you live in a major city, there’s a good chance you rely on some form of public transportation to get around. The rest of us, however, are stuck visiting the gas pumps.
Since the beginning of 2013, it’s been anything but a happy New Year, at least as far as gasoline prices are concerned. Since January 1st, the average price for a gallon of regular gas is up about 45 cents.
There’s no question that part of the rise in gasoline prices is due to higher prices for crude oil. But the bulk of the increase is due to what is known as the gasoline crack spread.
The crack spread is the difference between the price of crude oil and the wholesale price of gasoline. This can be easily seen in the chart below, courtesy of the Energy Information Administration (EIA).
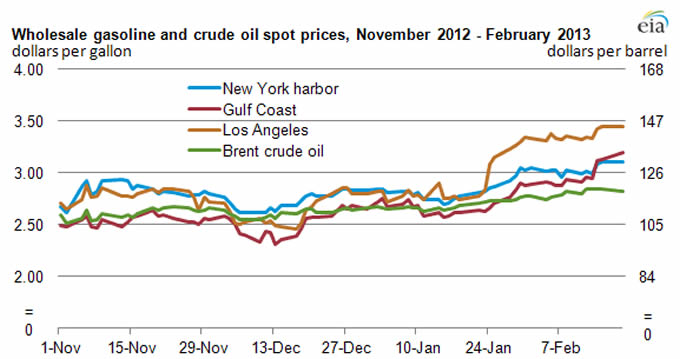
The graph tracks wholesale gasoline (priced per gallon) as compared to Brent crude oil (priced per barrel). Brent crude is linked to gasoline wholesale prices sold in most areas of the U.S. From January 1st through February 19th, Brent prices increased $6.00 per barrel. That equates to about 15 cents per gallon.
What about West Texas Intermediate (WTI) that comes from the Bakken, the Eagle Ford and other growing sources here in the U.S.? WTI is pipeline limited to most U.S. refineries. In addition, most U.S. refineries are set up to handle heavier crude.
More on Crack Spreads
There are different types of crack spreads. Refining margins are often estimated using crack spreads. A single product crack spread denotes the divergence in price between a barrel of crude oil and a barrel of gasoline or diesel. The most common single product crack spread is the one for gasoline.
However, it is not uncommon to calculate crack spreads using crude oil in combination with various refined products. The 3:2:1 cracks spread is a common multiple-product crack spread. It reflects the fact that a single barrel of crude produces two barrels of gasoline for every one barrel of distillate (diesel and bunker fuels).
The spread is actually calculated by adding the price of two barrels of gasoline and one barrel of distillate together and subtracting the price of three barrels of crude from the total.
What Contributes to Rising Crack Spreads?
While there are many factors that go into calculating the crack spread of gasoline, here are a few of the main ones:
•Refinery outages are always a factor. Whether they are planned or unplanned, an outage immediately reduces the U.S. capacity to produce gasoline.
•Global demand is generally in the up wards direction on an annual basis. There’s no reason that won’t continue. It’s that constant increase in demand that can effect refinery utilization rates, product mix and maintenance requirements.
•The refineries also have to shut down twice a year to switch from summer grades of gasoline to winter and vice-versa.
During the last quarter of 2012, the crack spreads for gasoline were extremely low. For some periods, they were actually negative. This meant a barrel of gasoline (at the wholesale level) actually cost less than a barrel of Brent crude.
Could gasoline be headed even higher from here? It’s hard to tell, given the multitude of factors that go into the cost of a gallon of gas. The crack spread is just one of the components (albeit a fairly large one) of that cost.
Short-term, the outlook for both gasoline and crude prices remains volatile. Things like extreme weather or geopolitical events (or the threat of either) also play a role in the price on any given day.
The Best Way To Save (Make) Money on Gasoline
HollyFrontier Corporation (NYSE:HFC) isn’t exactly a company on the tip of everyone’s tongue when talking about crude oil refineries, but perhaps it should be. The company operates five refineries with a combined crude throughput of 443,000 barrels per day.
HollyFrontier primarily serves high-value markets throughout the Southwest, Rocky Mountain and Mid-Continent regions of the U.S. That’s where its refineries are located too. That gives it a big advantage over coastal refineries. Why?
Most of the crude it uses as feedstock is WTI as opposed to Brent. WTI crude has been trading for as much as $20 per barrel less than Brent. Company shares have soared 61% over the last 12 months.
But don’t let that scare you. At 7.24, HollyFrontier has one of the lowest price-to-earnings ratios in the refinery sector. With its near-singular access to WTI, this could be one of the best bets for future earnings and share appreciation.
So while “pain at the pump” may be eating a hole in your wallet, you might be able to offset the damage by adding a few shares of HollyFrontier to your energy portfolio.
Good Investing,
Dave
Editor’s Note: There’s another little-known energy company that we believe will triple from today’s prices – no matter what happens with our fiscal issues in Washington. For the full story, click here.
Source: http://www.investmentu.com/2013/February/profiting-from-high-gasoline-prices.html
by David Fessler, Advisory Panelist, Investment U
Copyright © 1999 - 2013 by The Oxford Club, L.L.C All Rights Reserved. Protected by copyright laws of the United States and international treaties. Any reproduction, copying, or redistribution (electronic or otherwise, including on the world wide web), of content from this website, in whole or in part, is strictly prohibited without the express written permission of Investment U, Attn: Member Services , 105 West Monument Street, Baltimore, MD 21201 Email: CustomerService@InvestmentU.com
Disclaimer: Investment U Disclaimer: Nothing published by Investment U should be considered personalized investment advice. Although our employees may answer your general customer service questions, they are not licensed under securities laws to address your particular investment situation. No communication by our employees to you should be deemed as personalized investment advice. We expressly forbid our writers from having a financial interest in any security recommended to our readers. All of our employees and agents must wait 24 hours after on-line publication or 72 hours after the mailing of printed-only publication prior to following an initial recommendation. Any investments recommended by Investment U should be made only after consulting with your investment advisor and only after reviewing the prospectus or financial statements of the company.
Investment U Archive |
© 2005-2022 http://www.MarketOracle.co.uk - The Market Oracle is a FREE Daily Financial Markets Analysis & Forecasting online publication.