


Dow vs. Gold vs. XAU, What Gold Bubble?
Commodities / Gold and Silver 2013 Mar 07, 2013 - 09:11 AM GMTBy: Vin_Maru

The current bull market for gold has risen steadily for about 9 years, but on a percentage basis we still haven’t seen the exponential rise in a 1 to 2 year period that would clearly mark it as a bubble mania phase. In fact, after making solid gains and rising for 9 years, the gold market has essentially gone sideways over the last eighteen months. The good thing is that in the previous bubbles, after it burst the asset class had given back several hundred percent in the 1-2 years following the peak. Luckily we haven’t seen that in this bull run for gold, not yet anyways, but we could see the cycle bottom later this year. The recent correction has given back about 20% from the peak of just over $1900 to just below $1550.
Can the correction continue and steepen to the downside? Sure, anything is possible, especially in a market that can easily be manipulated. But looking at the charts below, gold never went into a mania exponential rise and has been consolidating sideways for 18 months. This gold bull market run is definitely not like previous bubbles and the further this correction at these prices goes out in time, the more likely we will still see one more mania phase push higher with a several hundred percent rise before we can state that gold is truly in a bubble.
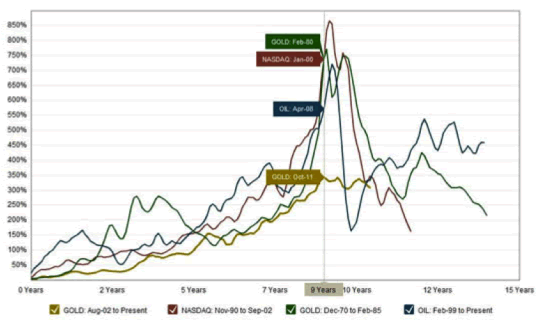
Graph courtesy of Macrotrends.org - This chart tracks the performance of gold since July of 2002 against the three largest bubbles of the last 40 years. Past bubbles have shown strong but steady growth for the first 7-8 years before moving into a hyper-growth phase for the last 18-24 months. Each series is adjusted for inflation and is smoothed with a 3-month moving average.
Dow vs. Gold Over the Last 100 Years and in the Current Bull Market
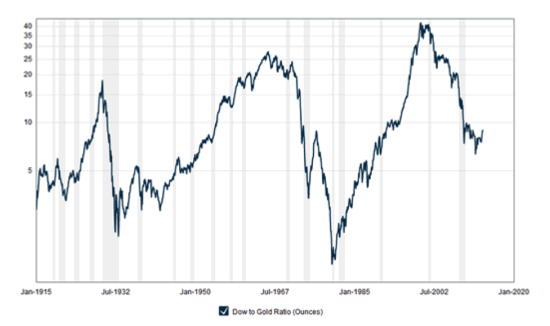
When we look at the Dow to Gold ratio for the last 100 years we see that the Dow has traded between less than 5 times the price of gold on several different occasions. Most of this time was between 1915 and 1940s, with the exception of the roaring 20s when the stock markets outperformed gold significantly. The only other time we saw gold become over valued compared to the Dow was during the 60s and 70s, this was the last time when gold was in a bull market and it lasted less than 20 years. From the early 1980s to about 2000, the Dow has clearly outperformed gold going from one extreme to another. In fact, at the peak of the Dow to gold ratio in 1999, you could buy the Dow 45 times over gold, but ever since then gold has been outperforming the Dow up until recently. What we haven’t seen during this bull market for gold is a Dow to Gold ratio below 5 which could easily mark gold as way over valued compared to the Dow. In order for gold to be considered in a bubble territory, history has shown us that we need the ratio to be clearly below 5 to 1 on a spike low.
Graph courtesy of Macrotrends.org
Now let’s take a look at the recent chart for Dow to Gold over the last 12 years shown below. Starting in 1999, the Dow was priced 45 times gold and since then has given up a significant portion of that ratio. In 2011, the ratio did go as low as 5.7 to 1 when the gold price peaked at about $1900 and ever since then the Dow has been advancing while gold has still been correcting. Today the Dow to Gold ratio is about 9 to 1 and the Dow just made all time highs at 14,286 while gold is sitting at about $1580.
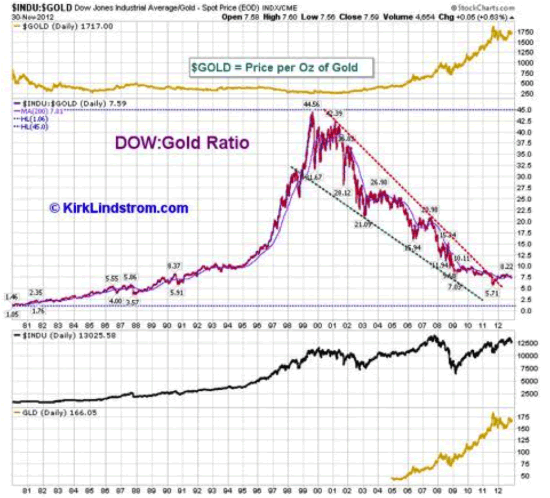
While the ratio is working in favour of the Dow for the moment, it would clearly need to break above 10 to 1 on a strong advance before we can say that gold is in trouble and that the bull market may be over. The 10 to 1 Dow to Gold ratio can be considered the line in the sand; this is where a period of great consolidation will take place before any judgement can be made. Assuming gold stays at about $1600, the Dow can easily move to all time new highs and towards 16,000, it will probably do so by May. At that time, the Dow will most likely take a pause and possibly start a correction going into the summer.
The only question is what will gold do once we reach the 10 to 1. Does it enter a strong bear market and retreat further compared to the Dow as it goes on to make all time highs from Fed enduced printing? Or does the bull market in gold reassert itself and the Dow starts a correction as we move back towards a 5 to 1 ratio. Looking at the chart above, the Dow to Gold ratio is still in favour of gold but has started to move sideways. Maybe a new trading range of 5 to 1 and 10 to 1 between the Dow and Gold still holds for the remainder of the decade. If that is the case, we are much closer to the Dow being at a top and gold at a bottom if the 10 to 1 ratio holds. At some point in the next decade we could see this ratio dip below 5 to 1 which would mean a strong rise in gold compared to the Dow at it enters bubble territory, but we are clearly not there yet.
One thing the charts above clearly show are that gold has never entered a strong parabolic rise into bubble territory. If that was the case, we would have seen a strong percentage gain of several hundred percent in gold within a very short period of time, of which it would be all given back in the same amount of time. Also, looking at the 100 year Dow to Gold ratio chart, the ratio never went below 5 to one which would mark that gold was way over valued compared to the Dow on a historical basis.
The Gold Miners Have Under Performed Everything
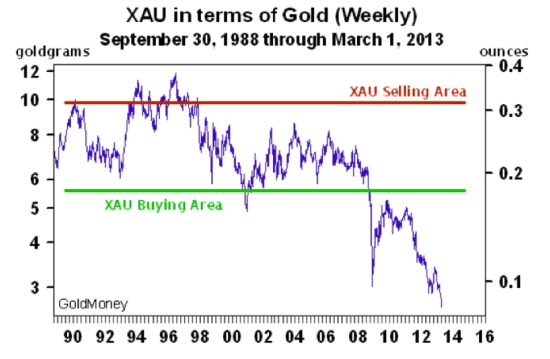
As for the gold miners, the XAU is a much broader index used to measure the performance of 30 mining companies. A chart courtesy of James Turk from Gold Money shows how the miners have done compared to gold since 1988. As we can clearly see, gold has outperformed the Dow and the miners during the current Bull Run we have been in. Following the melt down that started in 08, the miners have seriously underperformed and have gone on to historical lows compared to gold. During the 90s when there was technically no bull market in gold and you could buy the mining companies in the XAU index between 6 to 10 grams of gold. The range between 6 to 8 grams of gold for the XAU held between 2001 and 2008 when the bull market started. Since 2008, the miners have seriously underperformed versus gold and you can now buy the index for less than 3 grams of gold. The miners are extremely cheap compared to gold; in fact they probably have never been this cheap throughout history.
If you enjoyed reading this article and are interested in protecting your wealth with precious metals, you can receive our free blog by visiting TDV Golden Trader.
Cheers,
Vin Maru
Anarcho-Capitalist. Libertarian. Freedom fighter against mankind’s two biggest enemies, the State and the Central Banks. Jeff Berwick is the founder of The Dollar Vigilante, CEO of TDV Media & Services and host of the popular video podcast, Anarchast. Jeff is a prominent speaker at many of the world’s freedom, investment and gold conferences as well as regularly in the media.
© 2013 Copyright Jeff Berwick - All Rights Reserved Disclaimer: The above is a matter of opinion provided for general information purposes only and is not intended as investment advice. Information and analysis above are derived from sources and utilising methods believed to be reliable, but we cannot accept responsibility for any losses you may incur as a result of this analysis. Individuals should consult with their personal financial advisors.
Jeff Berwick Archive |
© 2005-2022 http://www.MarketOracle.co.uk - The Market Oracle is a FREE Daily Financial Markets Analysis & Forecasting online publication.