


Silver Price Crash Through Support Sets Scene for Further Steep Drop to Under $20
Commodities / Gold and Silver 2013 Apr 23, 2013 - 06:19 AM GMTBy: Clive_Maund

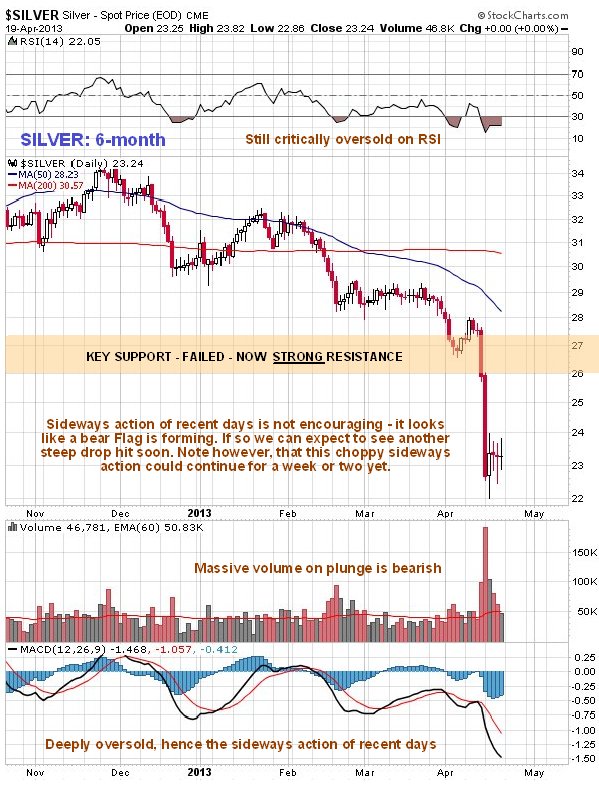
 Silver crashed its key support last week and plunged in sympathy with gold. On its 6-month chart below we can see the big drop that followed failure of the support, and how after plunging on Monday, it then steadied and traded in a narrowing range for the rest of the week, unlike gold which crept higher.
Although silver is more volatile and wild in its movements than gold, it has been following a parallel technical script, with support level failures and trendline breaks synchronizing with those of gold, as we will see.
The support level at $26 had become strong and exceptionally clearly defined, and with the passage of time more and more stops came to be clustered beneath it, so that when it failed mass selling triggered the plunge we saw last week, just as happened with gold. Volume on the drop was very heavy, which is bearish. What is likely to happen now is that a bear Flag or Pennant forms, perhaps for a week or two, which is then followed by another steep drop down into our provisional target zone in the $19 - $20 area.
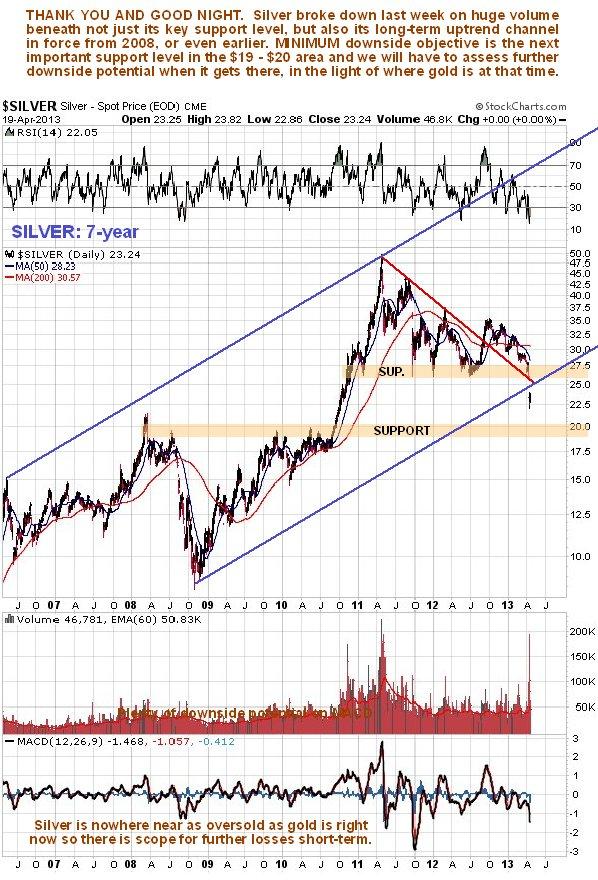
On the 7-year chart we can see that, as is the case with gold, silver's plunge last week breached not only the key support level, but also the lower support line of a parallel channel, although this is provisional as it is based on the presumption that a parallel channel exists. The high volume on the breakdown is bearish and the MACD indicator, which is nowhere near as oversold as gold's, shows that there is certainly scope for further losses going forward. The obvious immediate downside objective following this breakdown is the strong support in the $19 - $20 area, which MAY prove to be the bottom. Another important point to make is that, whatever happens, the breakdown below the key $26 support level has created a wall of overhanging supply from all those now trapped in the top area, who are likely to dump aggressively onto any rally above $26 and kill it, especially any attempt to get above this level over a shorter time horizon.
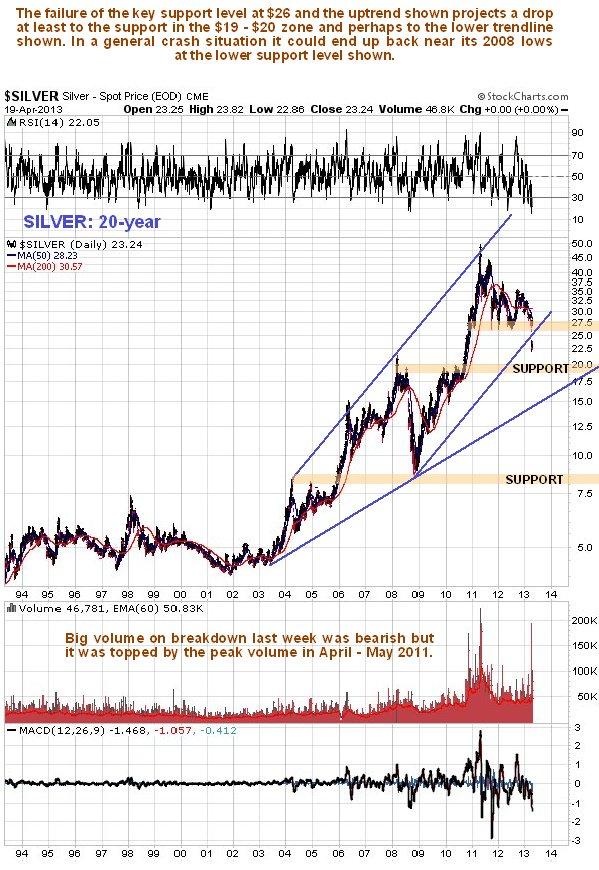
The 20-year chart for silver is most interesting to observe at this juncture as it shows silver's bullmarket from its inception. Just like gold, last week saw the failure of an important uptrend channel on strong volume, which projects a decline soon to the strong support in the $19 - $20 area, as explained above, but on this chart we also see that the price could dig deeper into the support arising from the price history from 2008 through 2010, and drop as far as the lower trendline shown, now at about $15, and still be in a bullmarket. This is both interesting to observe and encouraging. However, if the lower trendline fails we must then acknowledge that the bullmarket is over, and of course, this is only likely to happen in the circumstance of a grand asset liquidation where both commodities and stocks plunge, as in 2008.
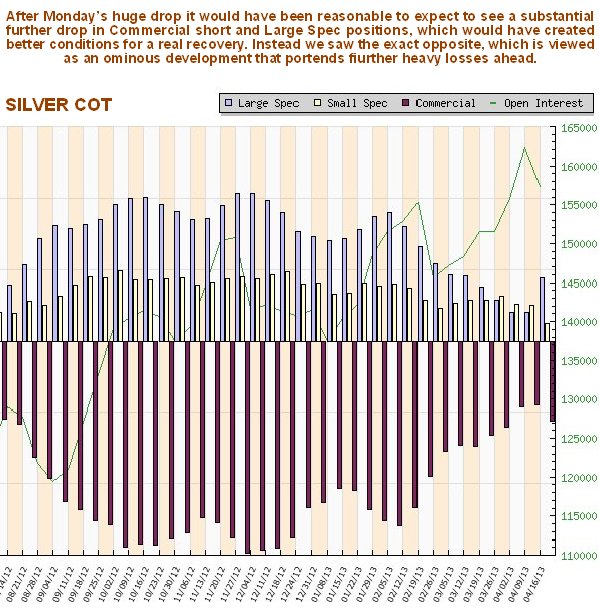
A startling revelation at the end of last week was the latest silver COT. With the plunge in the silver price going into Monday - and it was still low when the latest COT figures were taken on Tuesday night, we reasonably expected to see a further substantial drop in both Commercial short and Large Spec long positions, taking them closer to the zero line, but what happened? - the exact opposite. Commercial short and Large Spec long positions rose substantially. This is viewed as bearish and portending another sharp drop soon, and supports our conclusion that a bear Flag is probably forming in silver now.
If silver should have the nerve to approach the $26 level breakdown point over the near-term, which admittedly looks highly unlikely, it will be a great short.
By Clive Maund
CliveMaund.com
For billing & subscription questions: subscriptions@clivemaund.com
© 2013 Clive Maund - The above represents the opinion and analysis of Mr. Maund, based on data available to him, at the time of writing. Mr. Maunds opinions are his own, and are not a recommendation or an offer to buy or sell securities. No responsibility can be accepted for losses that may result as a consequence of trading on the basis of this analysis.
Mr. Maund is an independent analyst who receives no compensation of any kind from any groups, individuals or corporations mentioned in his reports. As trading and investing in any financial markets may involve serious risk of loss, Mr. Maund recommends that you consult with a qualified investment advisor, one licensed by appropriate regulatory agencies in your legal jurisdiction and do your own due diligence and research when making any kind of a transaction with financial ramifications.
Clive Maund Archive |
© 2005-2022 http://www.MarketOracle.co.uk - The Market Oracle is a FREE Daily Financial Markets Analysis & Forecasting online publication.