


Gold and Silver Inevitable Sentiment Reversal
Commodities / Gold and Silver 2013 May 06, 2013 - 07:07 PM GMTBy: John_Townsend

 The usefulness of sentiment's stealth crystal ball is about to be revealed to the litany of unsuspecting precious metal bears and skeptics who have convinced themselves that gold's bull market is either over or, at the minimum, in need of lengthy ongoing retesting, restructuring and consolidation.
This article will bring us up to date as to the degree of current bearish sentiment regarding both gold and silver using no fewer than 5 sentiment indicators (with 9 illustrative charts), as well as provide the reader with an opportunity to observe the price outcome of previous bearish extremes using these sentiment indicators.
When we begin the sentiment indicator discussion we will look at charts of the put/call volume ratio (options) of SPDR's Gold Trust ETF (GLD) and iShares Silver Trust ETF (SLV), then examine Hulbert's Gold Sentiment Index, followed by the Blees Rating, then gold's Commercial and Non-Reportable (futures) traders positioning detailed in the most recent Commitment of Traders Report (COT) from the CFTC, and conclude with a daily gold futures price chart that includes the corresponding readings of the Ulcer Index indicator.
But first, let's briefly consider the concept of investor sentiment.
My observation is that sentiment's crystal ball, particularly when observed at an extreme, works reliably despite conflicting and clever arguments of either a technical or fundamental nature, and plays the ultimate trump card in foretelling a market's reversal of price direction.
Sometimes the occurrence of a high volume "capitulation selling" event provides the most obvious observation of sentiment exhaustion. But there are numerous other means to assess this phenomenon and we will get to these shortly.
Sentiment extremes, simply put, tell us that there are too many traders at one end of the boat and therefore the boat is about to tip over. Sentiment can strongly suggest that the trade, as some say, has become "crowded". When someone finally yells "fire" in the "crowded" room there are so many of the market's participants motivated to get out the same door and in the same direction that most get trampled - unable to reverse their trade fast enough.
Another way of characterizing a sentiment extreme is to say that the trade simply runs out of buyers or sellers, as the case may be. The extreme price momentum in one direction "exhausts" itself of all available ammunition to continue the trend and is sometimes signaled when someone yells "fire" in the "crowded" room, but often comes to a conclusion unrecognized by most traders as price reverses direction in an unassuming manner.
Yet another saying is "when everyone is thinking the same thing, then no one is thinking". The sentiment indicators we will look at today will give us a clear sense as to whether this saying is potentially a significant and foretelling factor in future precious metal price movement.
And yes, there are indeed two players for each trade - the buyer and the seller. In our present precious metals situation, this leads us to consider the concept of shares moving from "weak" hands to "strong" hands.
The Claude Resources (CGR) shares I have been accumulating and holding with a considerable draw down are in "strong hands". Barring some unanticipated but significant company news, I have resolved to not sell any of my position even if price should continue to fall from the current $0.30 per share to $0.10.
However, as Claude Resources share price has fallen from about $1.00 last September to around $0.60 last January and just a couple months ago $0.50, obviously there have been too many shares of CGR still held by "weak hands". This will change because when the last "weak hand" is willing to sell their last share at this incredibly exaggerated market price, that obviously, will be the bottom.
You may have heard comments when a particular market bottoms and then begins to trade higher and then continues to trade even higher yet, despite "bad" news, the assertion that the bullish price movement seems to make no sense - that it cannot possibly be sustained. At this time it appears to nearly everyone the common sense question to ask is how "bad" news that used to cause a market to go into free fall now seems to have absolutely no negative effect? And to observe that as this market continues higher, it always leaves behind those traders stuck in pessimism to declare that the market is "climbing a wall of worry". That is, the "bad" news continues in the media, yet this particular market's price reversal continues upwards.
These thoughts are precisely what make this article's argument dead on target, in my opinion. That is, sentiment at extremes can and often does trump both technical and fundamental analysis. We are about to examine a number of these sentiment indicators which will leave little doubt that the precious metals market is presently at a sentiment extreme of historical proportion.
As markets usually swing from one price extreme to another, and markets usually swing from one emotional extreme to another (such as fear to greed), I believe the following sentiment indicators and their readings literally guarantee the continued reversal of gold and silver price to the upside.
So let's now take a look at the 5 sentiment indicators I have prepared for detailing the current gold and silver market sentiment and see what they are telling us.
We will begin with the put / call volume ratio of the options trade of the SPDR Gold Trust ETF (GLD) and iShares Silver Trust ETF (SLV). Charts courtesy of Schaeffer's Investment Research.
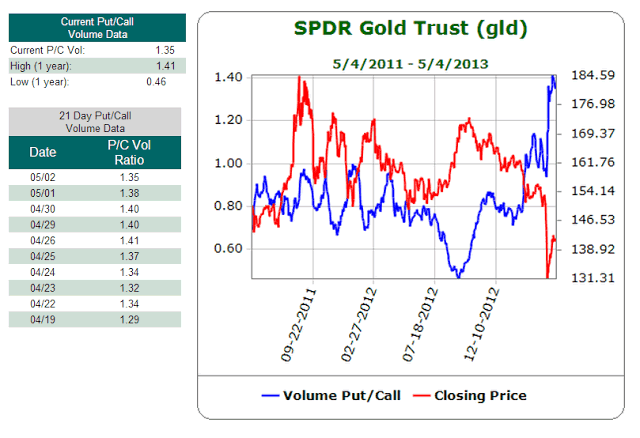
The red line in the charts are the ETF's price movement over the recent 2 years (GLD above, SLV below). The blue line is the put / call volume ratio. This considers the trading day's volume of puts traded and is divided by the volume of calls traded. Generally, the higher the put / call ratio, the more bearish traders are about the ETF's likely price movement, while the lower the put / call ratio, the more traders believe the ETF is bullish and going to rally higher.
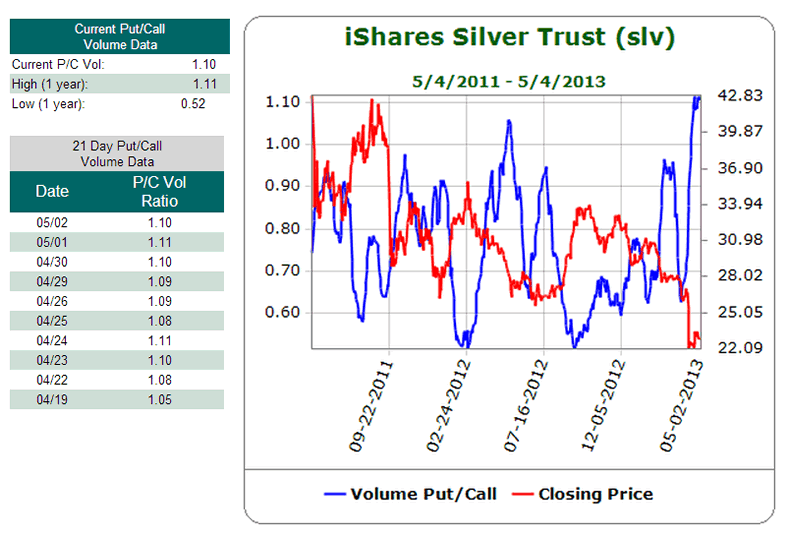
Undoubtedly you have noticed that both charts reveal that the put / call ratio is at the highs of the past two years; meanwhile price is at the lows of the past two years. I will leave it to you to observe the repetitively flip flop relationship between this sentiment indicator and price movement. For me, anyway, this indicator leaves little doubt as to the upcoming direction of GLD and SLV.
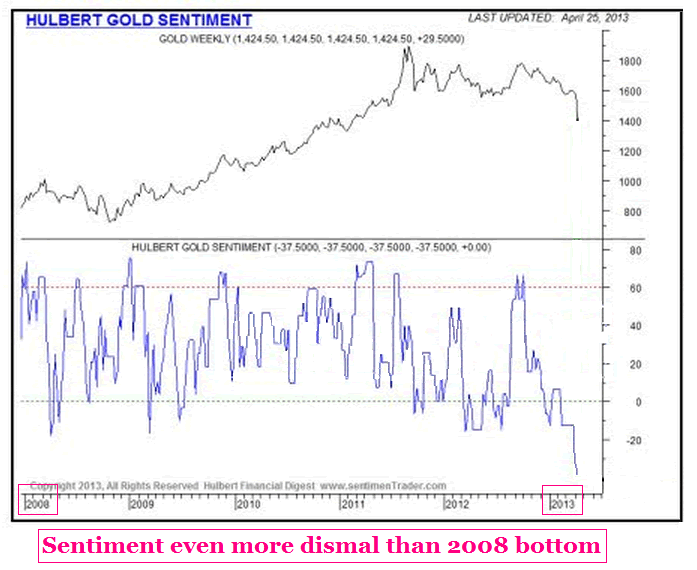
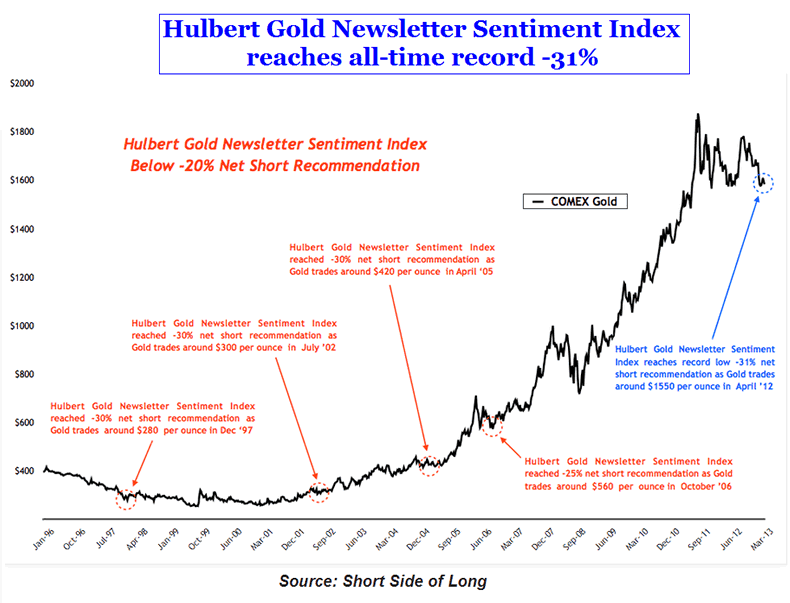
Next up is the Hulbert Gold Sentiment Index. This chart courtesy of Mark Hulbert's Newsletters. The chart that follows this first chart is courtesy of Short Side of Long.
Now we will turn to the Blees Rating with another pair of charts. The Blees Rating is simply a calculation that uses the COT report data on the positioning of commercial traders in comparison to their positioning 18 months previously.
The first chart is one that I made. It looks at the price movement of gold since September 2008 in the upper portion of the graphic, and displays the corresponding Blees rating in the lower portion of the graphic. The Blees rating this week, for the second week in a row, is 100. The green bars I added to the chart are intended to draw your attention to price action once a Blees rating of 100 is triggered.
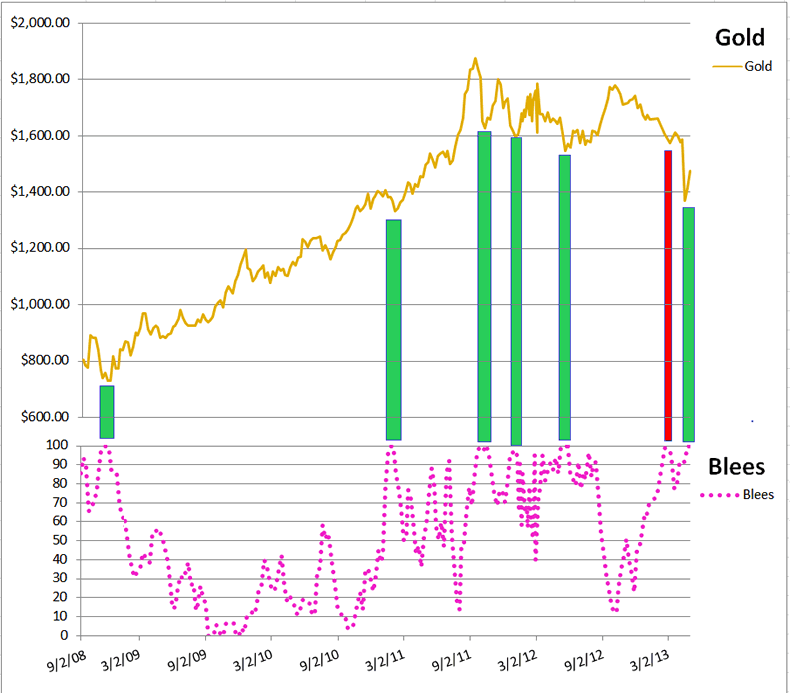
The red bar I added connects a Blees rating of 99 with price just before our infamous episode of a two day price crash in gold. Though I neglected to add another red bar in September 2008, you will notice that nearly the same thing happened at that time. That is, the commercial traders bellied up to the bar with a reading of 94 then apparently and correctly smelled a rat. They backed off and price indeed made one final swoon. Then in early November 2008 they bellied back up to the bar and held a 100 Blees rating for 2 consecutive weeks followed by another week at 99. They nailed the true bottom. I have no doubt they have done it in 2013, as well.
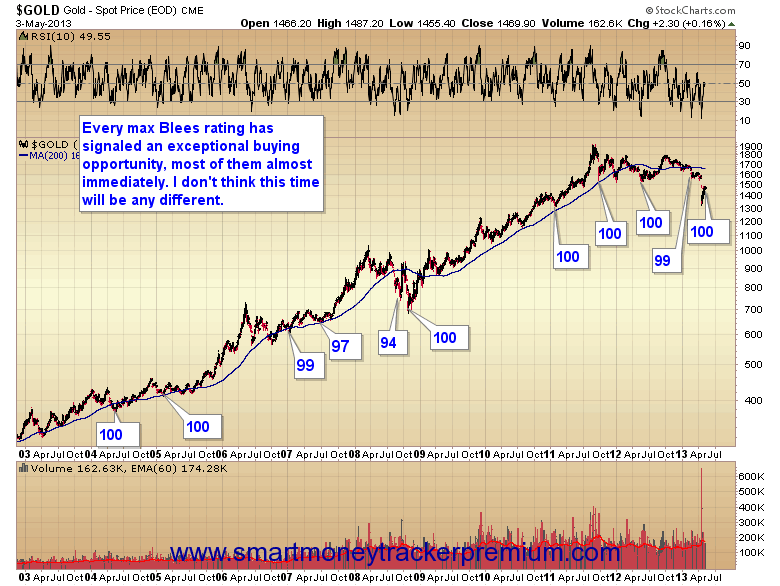
The following chart of $GOLD courtesy of SmartMoneyTrackerPremium details the locations of the maximum Blees rating since 2003.
Our next pair of charts looks at the positioning of gold futures traders as reported in the most recent Commitment of Traders (COT) report. Both charts are courtesy of GotGoldReport by Mr. Gene Arensberg.
First up is the commercials (dark blue line) and their net positioning of gold futures contracts since 2008. The price of gold is shown in magenta.
This group of traders is considered the smartest of the players and are hedgers by nature. It is indeed rare to find their net positioning anywhere near to just slightly short, as they are now positioned. Incidentally, they are now positioned exactly as when they correctly called the 2008 bottom.
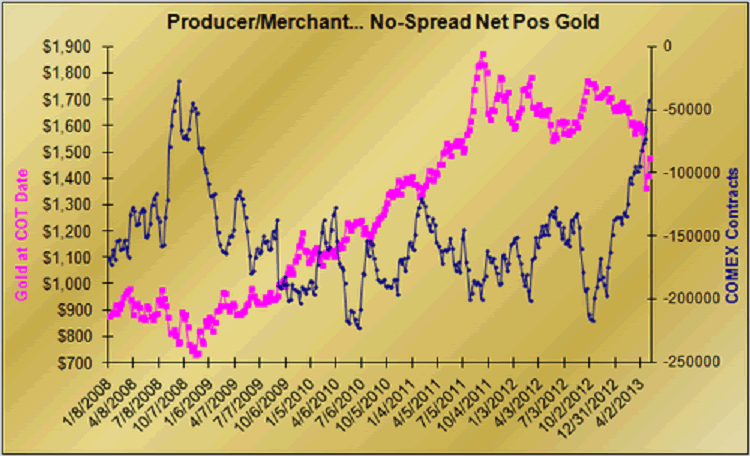
In Mr. Arensberg's accompanying dialog with these charts he noted that the commercial traders method of operation is to add shorts as price rises and add longs (or sell shorts) as price falls.
But interestingly, as gold has been raising $150 over the past two weeks, the commercials have been doing just the opposite of their norm. Instead of adding to their shorts as price has gravitated higher, they have reduced their shorts and added to their longs.
Yowzer! My take is that the commercials are essentially saying to the market, "bring it on".
Now for the chart of the little guys trading gold futures, otherwise known as the non-reportables.
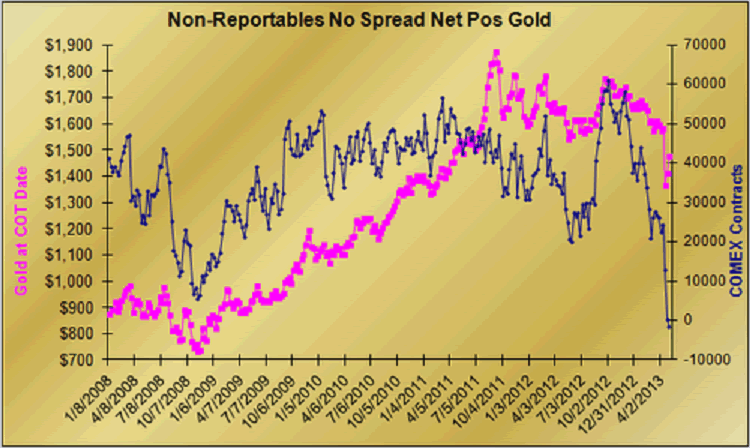
You can see that for the first time since 2008 this group (sometimes also known as the 'dumb money') has a net position that is just barely short (below ZERO). In effect, this group does not have any skin in the game and that has not been seen before. They have been suckered into losing their net long position and will have to buy, buy, buy when they figure out the trend is up.
And finally we conclude our pondering of 9 charts with this daily chart of gold futures (/GC) from 2007 and forward.
I created this chart and have added in the lower panel the Ulcer Index indicator. This is a volatility indicator that measures downside risk. The higher the indicator reads the higher the risk is considered to be if one continues to hold 'Old Turkey'.
From a sentiment point of view, the higher the indicator reads the scarier the ride for the long investor. I looked at this indicator on the daily gold futures chart back 20 years and I can tell you what we just experienced was the first place roller coaster drop of the past 20 years. If you still have your lunch (like me) you are likely qualified as a "strong hands" investor.
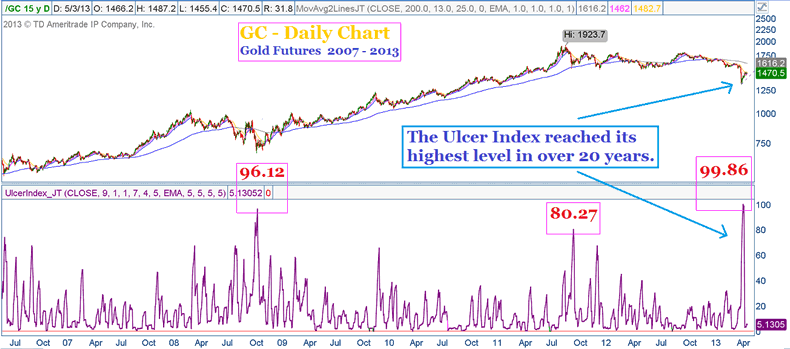
So there you have it. Sentiment on GLD and SLV options is crazy extreme, Hulbert's Gold Sentiment Index reveals sentiment is not only more bearish than the 2008 bottom - it's more bearish than anytime in the past 17 years (at least). The Blees Rating has been at the max of 100 for two consecutive weeks. The smart money commercials of the Comex gold futures market, despite the $150 rally we have had off the capitulation low a couple of weeks ago are not being shy. Price has been going up and they have just added to their long positions and reduced their short positions. Meanwhile the non-reportables have played themselves right off the field and will have to become buyers to get back in the game. And finally, the Ulcer Index confirms that gold has taken a hit that should have left EVERYONE running for the door.
You know, I don't make this stuff up. And after putting about 10 hours non-stop into making this article what it is, I have nothing more to say other than encourage you, another time, to consider the evidence that sentiment plays a powerful role in the trading markets and that if there was a better precious metal setup than the one we presently have - I simply do not believe it.
Best always,
John
John Townsend mailto:TSItrader@gmail.com
http://thetsitrader.blogspot.co.uk
© 2013 Copyright John Townsend - All Rights Reserved
Disclaimer: The above is a matter of opinion provided for general information purposes only and is not intended as investment advice. Information and analysis above are derived from sources and utilising methods believed to be reliable, but we cannot accept responsibility for any losses you may incur as a result of this analysis. Individuals should consult with their personal financial advisors.
© 2005-2022 http://www.MarketOracle.co.uk - The Market Oracle is a FREE Daily Financial Markets Analysis & Forecasting online publication.