


Gold Gets Sold
Commodities / Gold & Silver Mar 19, 2008 - 11:41 PM GMTBy: Joe_Nicholson
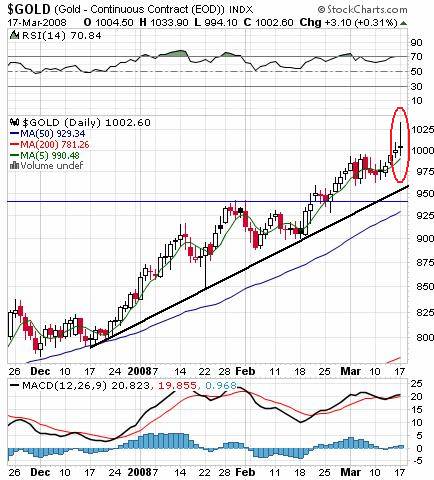
 TTC members were told Thursday morning we could be “hours or days” from a top in gold. The top actually printed two trading days later on Monday, when front month gold futures moved briefly above 1030 and sold off, producing a bearish reversal candle on the daily chart below.
It took until the nasty selloff Wednesday for most the rest of the world to see the situation for what it was. Silver had a silver setup, closing below $19 Wednesday afternoon. These sharp downward corrections in metals are exactly why this update never simply assumes the most bullish possible count and exercised due caution earlier in the year when bearish charts presented themselves.
The key to understanding the selloff is knowing the market, what moved gold so high in the first place. Certainly it was not natural buyers of physical metal – these tend to curb their buying as prices enter parabolic phases. Earlier in March it was reported that in India , where much of the world's retail demand for gold originates, owners were rushing to sell their gold to take advantage of the record prices.
No, it was hot money taking shelter against the sinking dollar, which was getting bashed by the Fed's bailout of the housing and credit markets. Sentiment had become overly bullish as gold approached and penetrated $1000/oz. Ironically the reversal comes on a .75 bps cut in the overnight rate, but such are market tops, and TTC members anticipated this as well. With the Street expecting as high as a 1.25% cut the actual cut with heightened anti-inflation rhetoric was actually a bit of a return to sanity from the Federal Reserve. This boosted the dollar and forced the liquidation of a whole lot of dollar hedges in precious metals.
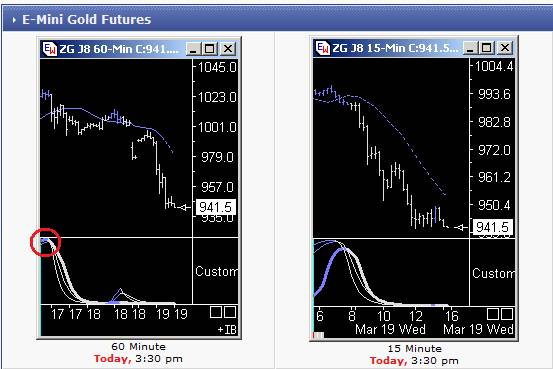
Of course spotting a top can be very lucrative, but should only be done with extreme caution and confirmation from several different methods. One useful indicator in catching this reversal in gold was the proprietary TTC trend cycle charts. Notice the 60-min chart above on the left finally rolled on the Tuesday, catching a fair majority of the decline to date. The faster moving 15-min chart on the right completed a low to high cycle during the choppy trading, providing a temporary short-covering or long scalping opportunity for the fastest traders.
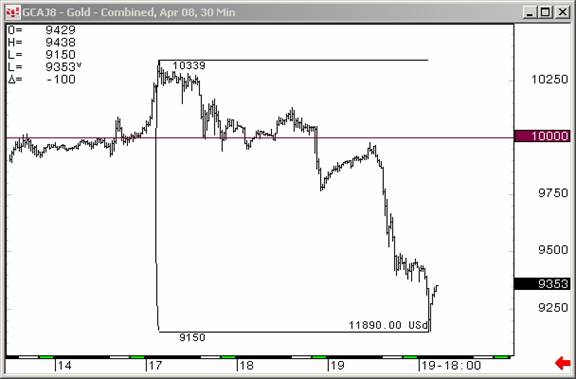
From Monday to Wednesday a single futures contract sold short netted $11,890. That's $118,900 for ten contracts! It's little wonder TTC members find it easy to make back the $129 monthly fee.
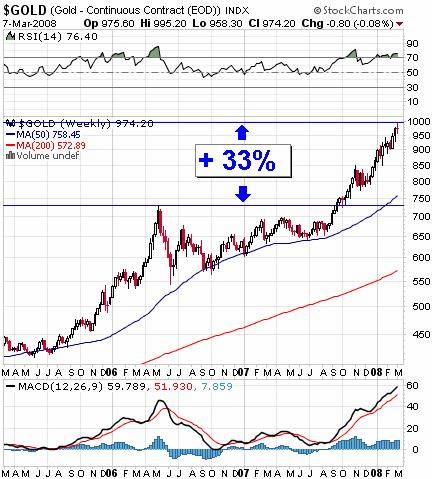
But just in case you were buying gold last week or on Monday, all is not necessarily lost. Those who bought the top in May 2006, if they had held on, would have been up over 35% on Monday. The question becomes whether this is the end of the bull market, or could another similar recovery happen again?
Answer the question for yourself. When the Fed announced last week it would accept mortgage-back paper as collateral, it essentially threw down the gauntlet and made a commitment to engage the credit crisis. This game changer alone was enough to have me limit my target in gold to roughly the $1000 range. Should the European economy falter relative to the U.S. economy, and especially if the ECB is compelled to cut interest rates, the intermediate term prospects of dollar-denominated gold will diminish. But, recent history tells us that last time the Fed funds rate was this low gold didn't start rising rapidly until after signs of recession were gone and the waves of inflation started by the low interest rates began to wash up in global markets. It's unlikely the ECB will begin anything like the dramatic rate slashing regime of the Fed, or that the rest of the world will decouple from the U.S. market.
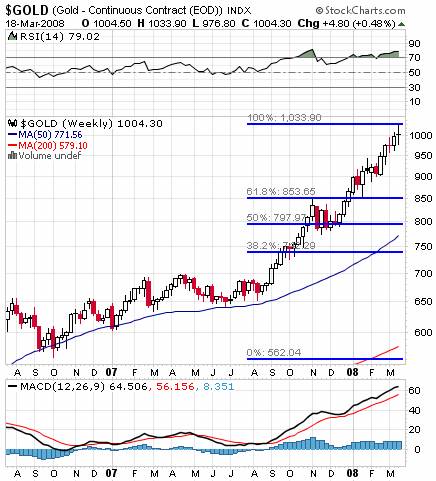
Make no mistake, the current trend now is clearly down as confirmed by violation of the 5-week sma on Tuesday and it should be expected that rallies will be used as an opportunity to further liquidate long positions. And because gold has moved so far so fast a substantial decline will likely ensue. But it would take a move below $750, that's over 25% from Monday's high, before there's serious damage to the bull market. It may not look pretty between now and then, but until conditions change, the 50-week moving average serves as support for the bull market. If that level holds again, it's quite likely we'll be looking at this week's top in the same way we recently saw the May 2006 highs.
If you feel the resources at TTC could help make you a better trader, don't forget that TTC will be closing its doors to new retail members this year. Institutional traders have become a major part of our membership and we're looking forward to making them our focus.
TTC is not like other forums, and if you're a retail trader/investor looking to improve your trading, you've never seen anything like our proprietary targets, indicators, real-time chat, and open educational discussions. But the only way to get in is to join before the lockout starts – once the doors close to retail members, we'll use a waiting list to accept new members from time to time, perhaps as often as quarterly, but only as often as we're able to accommodate them. Don't get locked out later, join now.
Have a profitable and safe week trading, and remember:
"Unbiased Elliott Wave works!"
by Joe Nicholson (oroborean)
This update is provided as general information and is not an investment recommendation. TTC accepts no liability whatsoever for any losses resulting from action taken based on the contents of its charts,, commentaries, or price data. Securities and commodities markets involve inherent risk and not all positions are suitable for each individual. Check with your licensed financial advisor or broker prior to taking any action.
Joe Nicholson Archive |
© 2005-2022 http://www.MarketOracle.co.uk - The Market Oracle is a FREE Daily Financial Markets Analysis & Forecasting online publication.