


June Silver's Weakest Seasonal Month Presents Buying Opportunity
Commodities / Gold and Silver 2013 Jun 11, 2013 - 06:32 AM GMTBy: Clive_Maund

 While silver is on the defensive short-term there is plenty of evidence that over the medium and longer-term it is setting up for a powerful rally. COT's and sentiment are already very bullish indeed, which means that when the turn does come, the rally is likely to be accentuated by panic short covering.
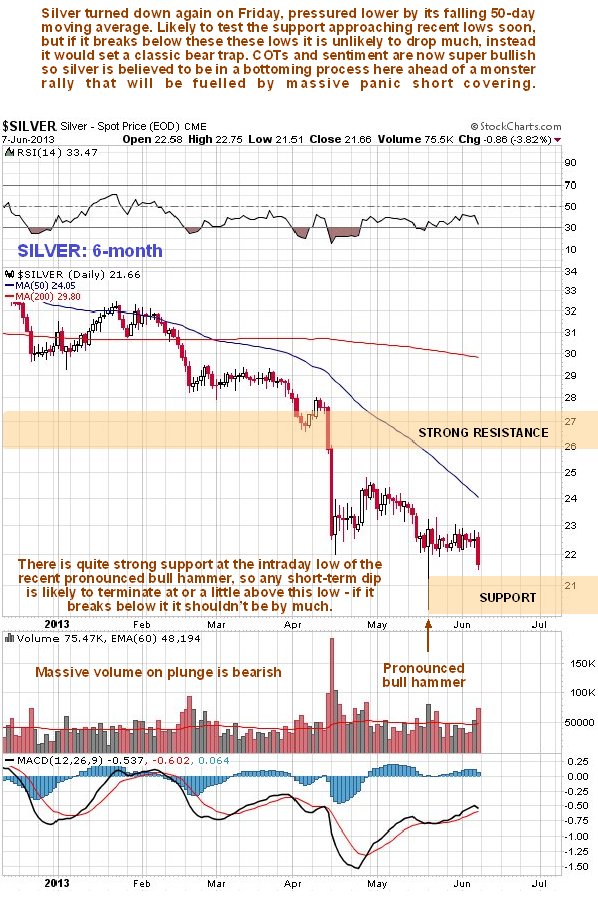
On its 6-month chart we can see how silver is being pressured lower by its falling 50-day moving average coming into play overhead, although the increasingly large gap between the 50 and 200-day moving averages is indicative of an oversold state that increasingly calls for reversal. Volume is still predominantly negative, suggesting lower prices dead ahead. After that we can expect reversal. There was a pronounced bull hammer in silver in the middle of May towards the intraday low of which there is quite strong support - silver may drop no longer than the low of this hammer.
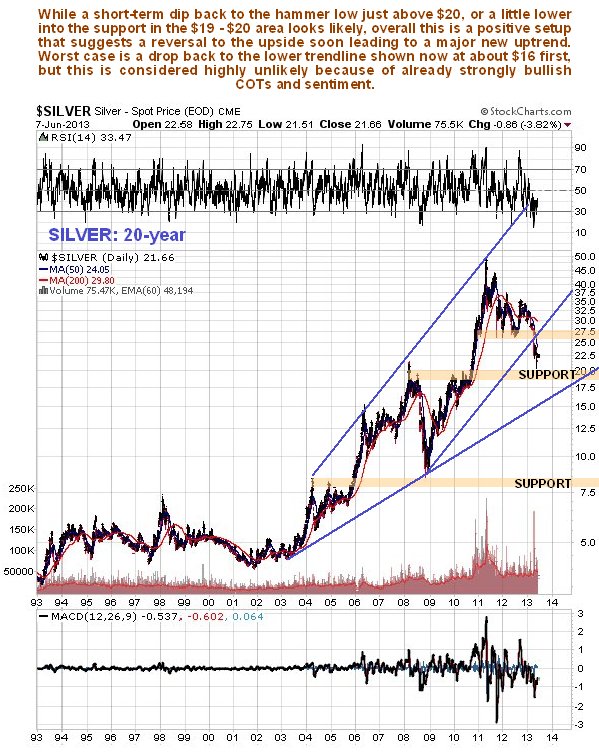
The long-term 20-year enables us to see the big picture to advantage and to determine where this correction is likely to stop. If the low of the hammer fails then the price may dip a little lower into the strong support in the extensive trading in the $17.50 - $20 zone that occurred in 2008, 2009, and the first half of 2010. There is really strong support in this zone that should turn the price back up. Worst case is a drop to the lower trendline shown now at about $16, but this is considered unlikely given the already strongly bullish COTs and sentiment.
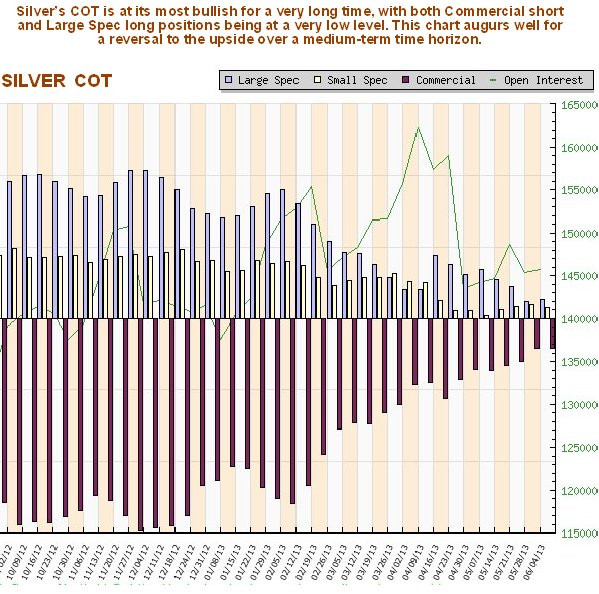
The retreat this year has given Big Money, the Commercials and the like, the opportunity to cover almost all of their shorts for a nice fat profit, and has left the dumb Large Specs smarting from huge losses. The COT chart shown below reveals that the Commercials have almost completed the process of unloading their short positions. The media driven Large and Small Specs, the 'victims', are totally discouraged and largely out. These are the lowest readings we have seen since the Precious Metals bullmarket started in the early 00's and needless to say this is now a powerfully bullish situation. It is now only a matter of time, and not much at that, before we see a dramatic reversal to the upside.
The longer-term COT chart shown below provides additional perspective and on it we can see that the Commercials' short positions have dropped to a very low level indeed - even lower than the freak market crash low of 2008. Meanwhile the habitual losers, the Large and Small Specs, are cowering in the corner licking their wounds, beset with timidity having reduced their long positions to very low levels. We are back at the starting line again with the stage being set for another major uptrend.
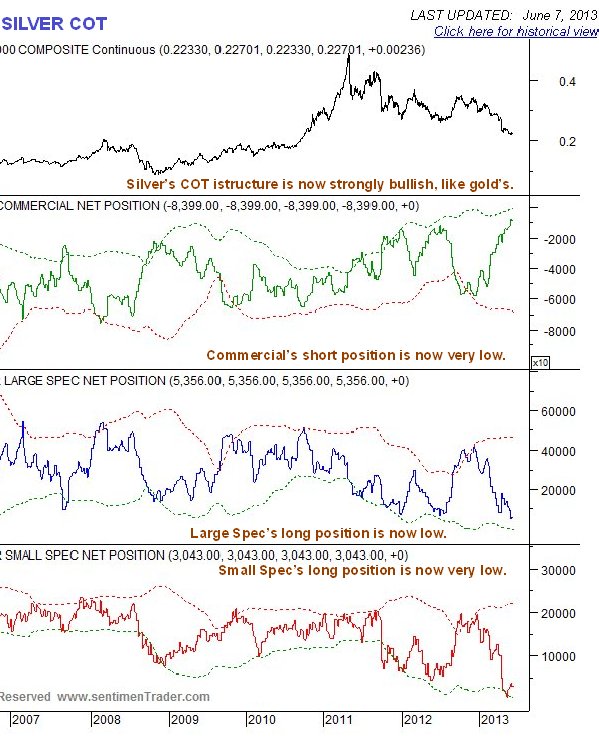
Chart courtesy of www.sentimentrader.com
Thus it should come as no surprise to see that Public Opinion on silver is now at a very low ebb.
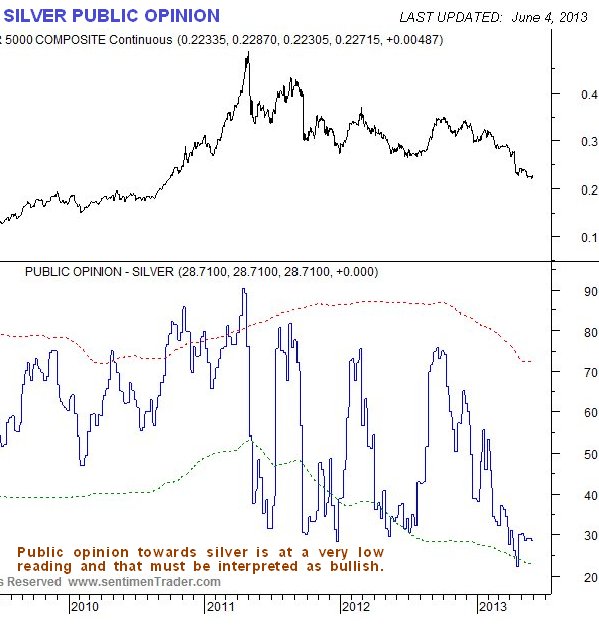
Chart courtesy of www.sentimentrader.com
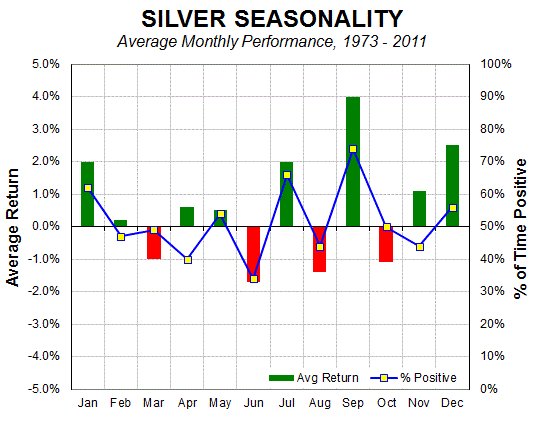
In the context of all that we have observed above, the silver seasonal chart is most interesting. For it reveals that June is the weakest month for silver, on a generalized seasonal basis, but after that, things look up in July and especially in September. What we can infer from this is that any short-term weakness over coming days and perhaps extending to 2 or 3 weeks should be seized upon as presenting a major buying opportunity. We will use this window of opportunity if it occurs as the perfect time to load up with a range of silver ETFs, better silver stocks - producers with little or no debt and Call options.
By Clive Maund
CliveMaund.com
For billing & subscription questions: subscriptions@clivemaund.com
© 2013 Clive Maund - The above represents the opinion and analysis of Mr. Maund, based on data available to him, at the time of writing. Mr. Maunds opinions are his own, and are not a recommendation or an offer to buy or sell securities. No responsibility can be accepted for losses that may result as a consequence of trading on the basis of this analysis.
Mr. Maund is an independent analyst who receives no compensation of any kind from any groups, individuals or corporations mentioned in his reports. As trading and investing in any financial markets may involve serious risk of loss, Mr. Maund recommends that you consult with a qualified investment advisor, one licensed by appropriate regulatory agencies in your legal jurisdiction and do your own due diligence and research when making any kind of a transaction with financial ramifications.
Clive Maund Archive |
© 2005-2022 http://www.MarketOracle.co.uk - The Market Oracle is a FREE Daily Financial Markets Analysis & Forecasting online publication.