


Gold Downward Spiral Targeting Primary Up-trendline at $840
Commodities / Gold & Silver Mar 23, 2008 - 05:16 AM GMTBy: Merv_Burak

What does one say after a week like this past one? Memories of an old movie come to mind and the saying “it was the best of times, it was the worst of times”, then off they went to the guillotine. Those with their heads still intact might eventually benefit down the road.
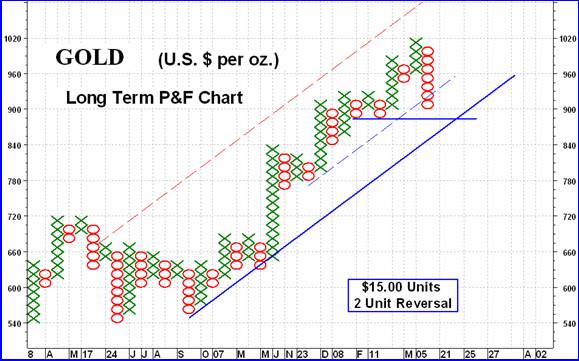
GOLD : LONG TERM
For those with a long term focus the long term P&F chart suggests that there is still no worry about a bear market. The price of gold would have to drop to the $885 level to break below both a (secondary) up trend line and two previous lows, or more importantly must move to the $840 level to break below the primary up trend line. Should such a break come, that would project down to the $720 level for now, but first things first. Let's check where we are with the normal charts and indicators.
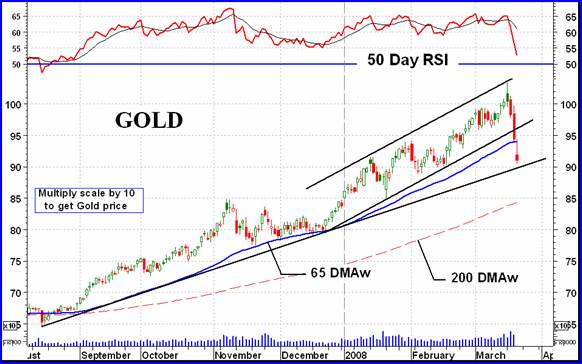
As shown on the intermediate term chart below, gold is still quite some distance above its positive sloping long term moving average line. Looking at a long term momentum indicator on a daily chart, the indicator took a sharp dive during the week, broke below three month support levels and is now at its level back in December. It is still, however, in its positive zone although it is below its long term negative sloping trigger line confirming the direction of the momentum (i.e. strength of recent price action) to be downward. Although I do not have the Thursday data the volume indicator still appears to be positive, above its long term positive trigger line.
Putting everything together, the long term rating continues to be BULLISH although starting to weaken.
INTERMEDIATE TERM
While writing last week's commentary I must confess that I did not expect things to happen as quickly as they had, although the warnings were all there. Both the channel support line (possibly called the fourth FAN trend line) and that momentum trend line shown last week, were broken on Wednesday. Now comes the real tough part, has the blow-off stage ended? I would be inclined to say YES, although a confirmation would be the breaking of that third FAN trend line shown just below Thursday's close. My one cautionary comment last week about the use of that third FAN trend line as the blow-off line was that it was too far away from the price action. That lower channel line seems to have solved that problem and I consider it as a rare fourth FAN trend line and a valid blow-off line.
So, where to now? Also mentioned last week was that second FAN trend line as a possible goal. At the present time it is at about the $710 level and rising. That would confirm the long term projection, once the long term breaks down (see above). Everyone likes projections but one should not take them as a given. Projections are just educated guesses. Let the continuing market action be your guide as to what's happening and which way things are proceeding.
As for the normal charts and indicators, the Thursday's close was below the intermediate term moving average line. The line itself has turned but only to a horizontal position. It will still take another day of trading below the moving average line for the line to fully slope downward confirming a change in direction. As we see, the intermediate term momentum indicator took a sharp plunge and is now back to its level in August. It is, however, still in its positive zone although below a now negative sloping trigger line. As for the volume indicator, up to the Wednesday's action (we do not get Thursday's volume data until Monday) the volume indicator is still above its positive sloping trigger line. Assuming a significant volume on Thursday it is likely that the volume indicator will drop below its trigger line but that the trigger line may not yet turn downward. Keeping all of the above in mind the intermediate term rating is in flux and somewhere in between a – NEUTRAL and a BEARISH rating. I'll call it a – NEUTRAL rating and see what develops on Monday.
SHORT TERM
What a miserable week. Will it continue, is what most want to know. Well, I don't know if it will continue but let's see what we can decipher from the chart and indicators.
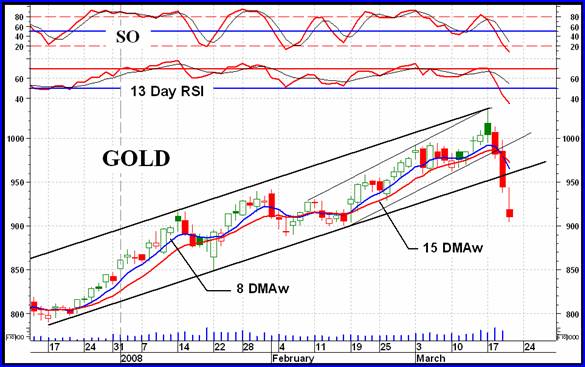
First, everything is now pointing lower. Gold is now most definitely in a downward spiral and is below its negatively sloping moving average line (15 DMAw). The short term momentum has plunged below its neutral line into the negative zone. The price action has broken below at least two up trend lines. The volume indicator is the only positive in the picture but the data is only to Wednesday and if we can assume Thursday's volume we are also in the negative here. The short term can only be rated as BEARISH .
What else is there? We now have the very short term moving average line (8 DMAw) below the short term (not good). The momentum indicator is lower than it was at the start of the recent rally, in December (not a good sign). The more aggressive Stochastic Oscillator (SO) is also below the levels of the past several months. Although not good either, it has entered its oversold zone. This then allows for some hope that a rally of sorts, or at worst a lateral period may be in the cards just ahead. However, looking at Thursday's action we see what is sometimes referred to as a “Long Upward Shadow” in Candlestick language, where the body is inside the bottom one third of the full trading range. This is thought of as a bearish signal. Unfortunately, except for this possibility of a rally ahead, there is nothing much one can grab on to as bullish in these indicators.
This seems to be a good time to sit back and relax until some turn around has been verified. Yes, I know, one might just miss the absolute bottom but there might be many times along the way that one might just miss the absolute bottom, before the absolute bottom comes along.
SILVER
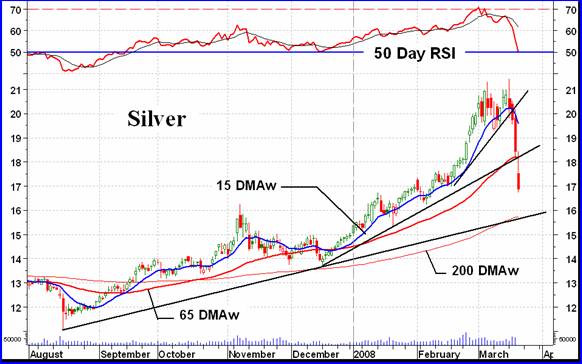
It's not surprising that silver took a bigger hit this past week than gold. It had a better advance since the August low so the bigger up, the bigger down. Looking at the intermediate term gold chart above and comparing it to the silver chart there are some interesting differences but in general the two have been acting together. The notable difference is the rally since December.
The silver upside strength exceeded that of gold with the silver momentum indicator breaching its overbought line while gold was some distance from its line. Silver did not indicate any strength decrease until the past several days, and then it gave a warning of a possible top somewhat better than did gold. Now, silver is driving the down side. Unlike gold, the silver intermediate term moving average has already turned downward. The intermediate term momentum indicator is closer to going negative, in fact the momentum is reading 50.00 and couldn't be any closer to going negative. Again, unlike gold where we have an intermediate term rating not quite fully bearish yet the rating for silver is BEARISH .
Precious Metals Indices
The table of precious metals Indices is a disaster. Double digit losses all over the place. The only positive in the table is the U.S, Dollar Index, which is thought of as a contrary indicator and doing its job. The quality stocks were the ones that took the biggest hit during the week. All 30 component stocks in my Merv's Qual-Gold Index lost ground during the week. Is this the “quality” long term “investor” jumping ship? Overall, there were only 10 winners in my universe of 160 stocks. That's only 6% on the up side. A really bad week.
Despite the run up in the larger gold stocks, as indicated by the major North American Gold Indices moving well into new high territory, the vast majority of stocks have gone nowhere over the past year. The chart of the universe of 160 stocks, as well as the speculative and gambling stocks, suggests that for the past year there has been a topping activity going on. If so then we may be in for a worse market in gold stocks than anyone is expecting. I hope I'm wrong in this assessment but that's the way it's beginning to look. Of course, should the speculative stocks plunge further the quality may not necessarily follow immediately but follow they will. In checking the table each week, should we see the Merv's Gold & Silver 160 Index climb past the 2820 level we will then know this assessment was wrong, however should the Index drop below the 2450 level we know we're in trouble. Next would come support at 2150 and below that who knows, by that time everyone should be out of stock and just relaxing and taking in the scenery, waiting for the bottom and a new bull market.
Merv's Precious Metals Indices Table
That's it for another week.
By Merv Burak, CMT
Hudson Aero/Systems Inc.
Technical Information Group
for Technically Uranium with Merv
Web: http://techuranium.blogspot.com/
e-mail: merv@themarkettraders.com
During the day Merv practices his engineering profession as a Consulting Aerospace Engineer. Once the sun goes down and night descends upon the earth Merv dons his other hat as a Chartered Market Technician ( CMT ) and tries to decipher what's going on in the securities markets. As an underground surveyor in the gold mines of Canada 's Northwest Territories in his youth, Merv has a soft spot for the gold industry and has developed several Gold Indices reflecting different aspects of the industry. As a basically lazy individual Merv's driving focus is to KEEP IT SIMPLE .
This Blog is - A periodic review of the daily or weekly market action in uranium stocks. The review is strictly from the technical perspective. Merv is a pure market technician. Weekly, one will find a table of technical information and ratings of the 50 component stocks of the Merv's Uranium Index as well as a weekly summary of the uranium stock activity. Daily (most days), one will find a daily review of the market action of the Merv's Daily Uranium Index as well as technical analysis of one or more uranium stocks of interest.
Disclaimer - Technical analysis is not perfect. Should you expect perfection this is not the site for you.
Technical analysis IS a very sound technique to assess the daily or weekly trading activities in securities and to assess appropriate timing of investment activities. This blog provides such technical analysis of the trading activity in uranium stocks for your information. Any use made of this information is strictly at the users risk. No guarantees are made for the accuracy or potential for the information provided herein. Use at your own risk. You are strongly advised to check with your broker or investment adviser before activating any investment desisions.
Merv Burak Archive |
© 2005-2022 http://www.MarketOracle.co.uk - The Market Oracle is a FREE Daily Financial Markets Analysis & Forecasting online publication.
Comments
|
sandeep ghai
24 Mar 08, 05:04 |
Great information given by you thanks
Dear, I just want to thank you for the information which you have provided for us. Thanks. |