


Dow and Gold Silver Ratio Signals Coming Silver Price Rally
Commodities / Gold and Silver 2013 Jul 03, 2013 - 03:34 PM GMTBy: Hubert_Moolman

 The Dow, in particular, has been the biggest obstacle to a rise in precious metals, due to it sucking up most of the available value on global markets. However, it appears that this obstacle is now out of the way, with the Dow likely having peaked.
Below, is update of the fractal comparisons between the current period and the 70s, I have done for the Dow in a previous article:
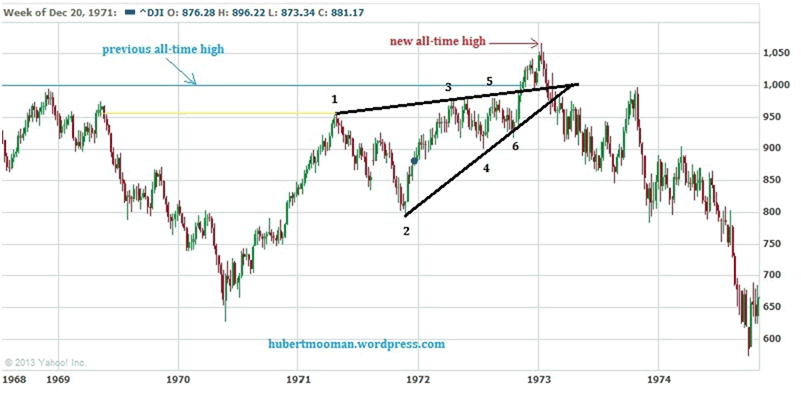
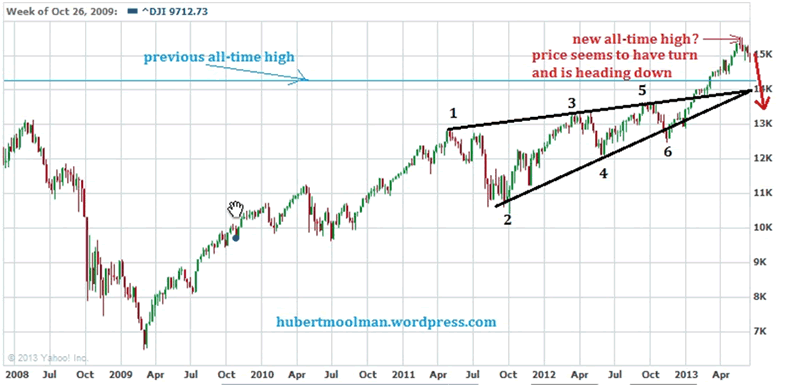
(chart from yahoo)
The top chart is the Dow from 1968 to 1974, and the bottom one is the Dow from 2008 to 14 June 2013. I have illustrated how these patterns are alike by marking similar points from 1 to 6. It appears that there is a very good chance that we have finally reached the peak for the Dow.
This is a good picture of the medium-term situation that the Dow finds itself – right before a major decline just like in 1973. In 1973, soon after the Dow peaked, gold and silver started a massive rally; therefore, it appears that then, the Dow was also an obstacle preventing a silver and gold rally. This is, therefore, an indicator that we could be close to a major spike in gold and silver, as explained in a previous article.
Gold/Silver Ratio
The gold silver ratio is also, showing strong signs that silver and gold is about to spike significantly. Below, is a gold/silver ratio chart from stockcharts.com:
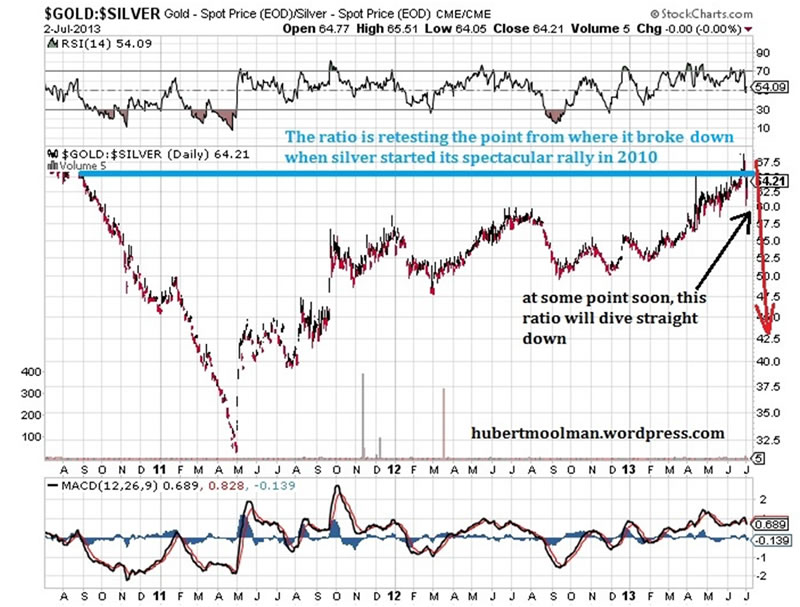
The ratio is currently retesting the area from which it broke down when it started the spectacular rally in 2010. If this area between 67 and 70 holds, then the ratio is likely to fall significantly. Note that this ratio falls significantly mostly when silver and gold is having a rally (with silver outpacing gold of course).
Silver Chart
Below, is a silver chart from 2006 to 2013 (generated at fxstreet.com)
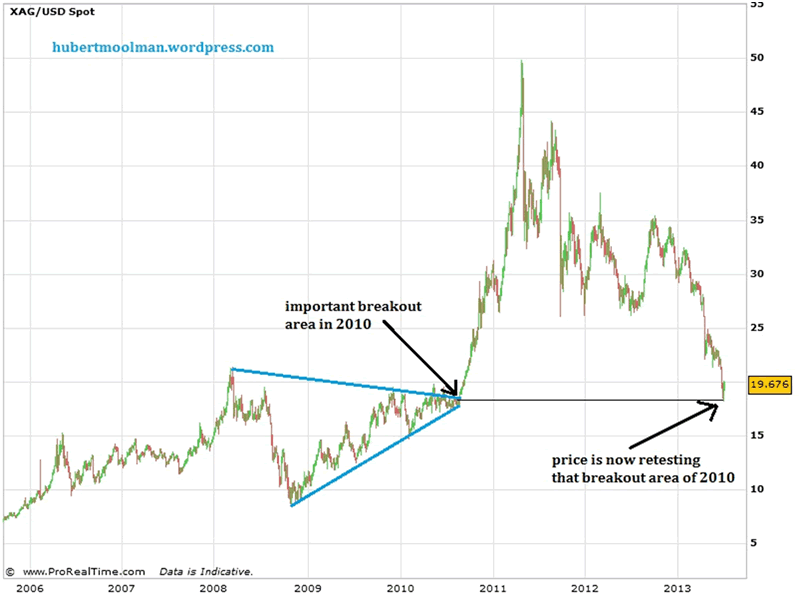
Silver is currently retesting its important breakout area of 2010 (similar to the gold/silver ratio). That breakout area of 2010 appears to be a critical area. If this area holds (which is very likely), then silver is likely to start a massive multi-month rally. Additional analysis is contained in my premium service.
Remember that these are massive patterns, so much patience is needed.
Conclusion
It is very unlikely that both the Dow and gold & silver are going to make new significant all-time highs from here. We, therefore, have to decide whether it is equities that will continue a bull market from here, or gold & silver.
Warm regards and God bless,
Hubert
http://hubertmoolman.wordpress.com/
You can email any comments to hubert@hgmandassociates.co.za
© 2013 Copyright Hubert Moolman - All Rights Reserved
Disclaimer: The above is a matter of opinion provided for general information purposes only and is not intended as investment advice. Information and analysis above are derived from sources and utilising methods believed to be reliable, but we cannot accept responsibility for any losses you may incur as a result of this analysis. Individuals should consult with their personal financial advisors.
© 2005-2022 http://www.MarketOracle.co.uk - The Market Oracle is a FREE Daily Financial Markets Analysis & Forecasting online publication.