


Gold and Silver Bearish Momentum
Commodities / Gold & Silver Mar 31, 2008 - 08:52 AM GMTBy: Merv_Burak

 The week started okay but ended on a sour note. It's not the time to panic yet but not the time to plunge in either. One should have well placed stops, relax and watch the action in comfort. Let others tear their hair out worrying what will happen next.
GOLD : LONG TERM
Nothing much has happened in the long term P&F chart so no need to comment on it this week. You may go to archive commentaries for still appropriate P&F analysis.
As for the normal indicators, here too nothing much has changed. From the long term perspective one should not expect continual change in the prognosis but more gradual change, if at all. The gold price is still far above its positive sloping long term moving average line. The long term momentum indicator is still comfortably within its positive zone although already below its negative sloping trigger line and heading lower. The volume indicator is well above its long term trigger line but if we are in a topping phase then the volume indicator is often a lagging indicator so one should not jump to conclusions at this time as far as it is concerned (unless the volume indicator turns sour, then it is telling us something). For now there is still no reason to change the long term rating. It remains BULLISH .
INTERMEDIATE TERM
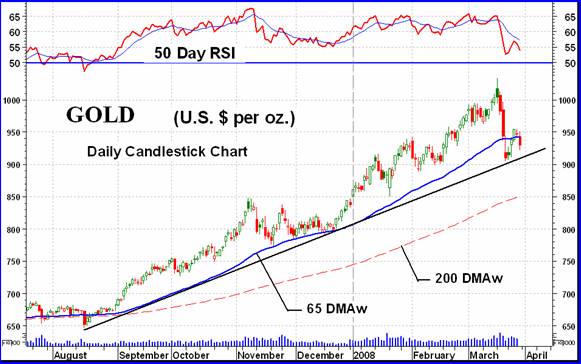
An intermediate term P&F chart had given us a bear signal with two projections, the $830 and $790 levels. If we take the average projection we get a move presently projecting to the Nov/Dec congestion area of last year. If we check back a couple of commentaries ago we see the three accelerating bearish FAN trend lines. The third FAN trend line is shown in the chart here, and it has not yet been breached. From my FAN Principle we need to breach that third FAN trend line to confirm a bearish trend. That could very possibly come this week. Should that FAN trend line be breached then the second FAN trend line would be the logical goal for the price, based upon the FAN Principle. That would be somewhere around the $750 mark depending upon timing.
As you see, technicians have a variety of techniques to use to determine what's happening in the market and where it is likely to go. If one doesn't work there is always a second one. I am a pure technician but I do know nothing is perfect so my final analysis is just to go with the trend in progress and go where it takes me, and reverse when the indicators say the trend has changed. A little definition is in order. When I talk about the “trend” I usually refer to the price or indicator confirmed trend for that time period. I often also refer to “direction”. This is usually referred to as the latest direction of the price or indicator but which may not have yet resulted in a change in trend. A trend may be bullish but the direction of the latest action may be downward but not yet reversing the trend. The direction may change a few times without ever changing the trend. I hope I haven't muddied up the thinking too much here.
So, where are we with the intermediate term trend and direction. Well, the price of gold is below its positively sloping moving average line. Over the past several days the trend of the price action has whip-sawed in that it was negative, turned to positive for a couple of days and although the direction of the price is downward the trend has not yet been confirmed to the down side. We need the moving average slope to turn downward again to confirm a negative trend. As for the momentum indicator, it is still positive in that it is above its neutral line but the direction is negative in that it is below its trigger line and the trigger line is sloping downward. When I combine these trends and directions I get a not quite bearish rating for the intermediate term. The intermediate term rating is at a – NEUTRAL rating, one level above a full bearish rating.
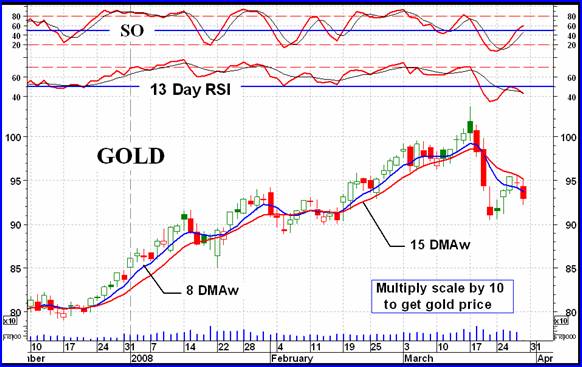
SHORT TERM
We seemed to have a short term rally early in the week but before the short term trend could be confirmed by the indicators it fell apart. Both the moving average (15 DMAw) and the short term momentum (13 Day RSI) halted the direction of the price on Thursday before the price could break through either the moving average line or the momentum neutral line. The momentum indicator did move above its trigger line for a couple of days but the trigger refused to turn up to confirm a new direction. So, everything remains negative without a trend change confirmation. The short term remains BEARISH .
Looking at the very short term, the price did breach the 8 DMAw line but the line remained in a negative slope also refusing to confirm the new direction. As for the Stochastic Oscillator, it has moved into its positive zone above its positive trigger line. Despite two negative price days the SO continues to move higher. This may be a sign that the reaction on Thursday and Friday may not last long, but I'll wait for the turn and confirmation. If I was to rate the very short term (always a risk as things change so fast) it would be a – NEUTRAL rating.
SILVER
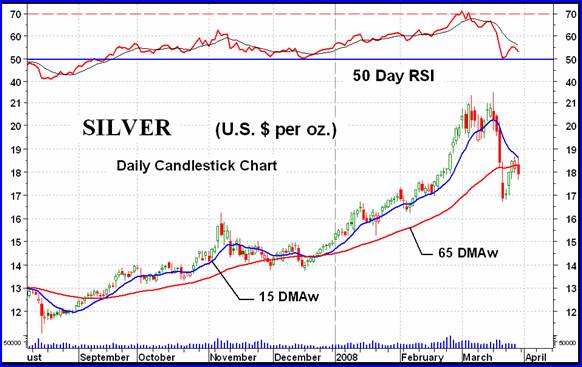
Silver had the same three up and two down days as had gold but the final weekly performance came out a lot better. Silver gained three times as much as did gold advancing 6.3% while gold only advanced 2.1%. Other than that the two metals have about the same charts and indicators. The main difference between the two is that from an intermediate term basis gold seems to have had a stronger momentum (or strength) behind its price move than had silver. Both momentum indicators have a very similar chart but while gold momentum has kept clear of its neutral line the silver momentum has been toying with its neutral line on more than one occasion. It almost went into the negative last week. Should the market continue to weaken it is highly probable that silver will confirm an intermediate term bear before gold does. For now, the ratings remain the same as for gold, long term BULLISH , intermediate term – NEUTRAL and short term BEARISH .
Precious Metals Indices
Well, the Precious Metals Indices Table looks a hell of a lot better this week than it did last week. Except for the U.S. $ Index (which usually moves counter to gold) everything else was on the plus side with weekly gains anywhere from 1.3% to 11.9%. The majority of the major and Merv's Indices were in the 3%, a percent, level. The long term and intermediate term ratings changed very little although a few Indices did improve somewhat. Looking over the universe of 160 stocks there were 104 winners during the week (65%) and 43 losers (27%) with 13 unchanged. With such an abundance of positive closes during the week it was inevitable that the summation of individual stock ratings would improve, but they still ended in bearish territory. For the Merv's Gold & Silver 160 Index, the overall summation of ratings ended like this:
Short term: BULL 21% (last week 8%), BEAR 70% (last week 82%)
Intermediate term: BULL 25% (last week 17%), BEAR 62% (last week 72%)
Long term: BULL 34% (last week 32%), BEAR 55% (last week 62%)
So, a slight movement towards the positive but still some distance from the group as a whole becoming bullish.
As far as the major gold stocks are concerned, the Merv's Qual-Gold Index includes the 30 largest gold stocks traded in the North American market. The average gain of these 30 stocks was 3.6% on the week. You get a slightly different impression if you follow the PHLX Gold & Silver Sector Index, which showed a gain of 4.8%. This is, of course, due to the fact that a very few of the highly weighted stocks in the Index did better than the average and had a disproportionate effect on that Index. On the week 26 of the 30 stocks advanced while 4 declined (last week all 30 declined). The summation of individual stock ratings looks like this:
Short term: BULL 10% (last week 0%), BEAR 83% (last week 90%)
Intermediate term: BULL 25% (last week 13%), BEAR 62% (last week 77%)
Long term: BULL 52% (last week 50%), BEAR 45% (last week 47%)
The bounce in the precious metal stocks this past week still has a long way to go to wipe out the previous week's decline. The charts and ratings do not yet justify getting back into the market at this time, unless you are a gambler and want to try and pick the bottom.
Merv's Precious Metals Indices Table
That's it for another week.
By Merv Burak, CMT
Hudson Aero/Systems Inc.
Technical Information Group
for Technically Uranium with Merv
Web: http://techuranium.blogspot.com/
e-mail: merv@themarkettraders.com
During the day Merv practices his engineering profession as a Consulting Aerospace Engineer. Once the sun goes down and night descends upon the earth Merv dons his other hat as a Chartered Market Technician ( CMT ) and tries to decipher what's going on in the securities markets. As an underground surveyor in the gold mines of Canada 's Northwest Territories in his youth, Merv has a soft spot for the gold industry and has developed several Gold Indices reflecting different aspects of the industry. As a basically lazy individual Merv's driving focus is to KEEP IT SIMPLE .
This Blog is - A periodic review of the daily or weekly market action in uranium stocks. The review is strictly from the technical perspective. Merv is a pure market technician. Weekly, one will find a table of technical information and ratings of the 50 component stocks of the Merv's Uranium Index as well as a weekly summary of the uranium stock activity. Daily (most days), one will find a daily review of the market action of the Merv's Daily Uranium Index as well as technical analysis of one or more uranium stocks of interest.
Disclaimer - Technical analysis is not perfect. Should you expect perfection this is not the site for you.
Technical analysis IS a very sound technique to assess the daily or weekly trading activities in securities and to assess appropriate timing of investment activities. This blog provides such technical analysis of the trading activity in uranium stocks for your information. Any use made of this information is strictly at the users risk. No guarantees are made for the accuracy or potential for the information provided herein. Use at your own risk. You are strongly advised to check with your broker or investment adviser before activating any investment desisions.
Merv Burak Archive |
© 2005-2022 http://www.MarketOracle.co.uk - The Market Oracle is a FREE Daily Financial Markets Analysis & Forecasting online publication.