


US Stock Markets Reach a Cross Road, Time to Start Looking for a Top
Stock-Markets / Stock Markets 2013 Aug 04, 2013 - 07:14 PM GMT

 I have been targeting a move into the 1700SPX for a while, to the dismay of the bears, the bulls finally stuck a nail in the coffin of the bears, no matter how many times the bears keep getting run over they just seem to enjoy picking tops and loosing $$, it seems the bears just don't learn their lesson. I wonder if these perma-bears that keep picking tops have any $$$ left.
There is time to be bullish and time to be bearish; Elliott Wave helps us in that regard, if Elliott Wave is used correctly. Fortunately for us, we use it well enough that it is a tool for us, not a hindrance.
Having met our target at 1700SPX, it's now that I am starting to get the bear suit out of closet, with the sentiment reaching extreme levels; I think it's now time to start to looking for a possible top, a top that might surprise many bulls.
SPX (short term)
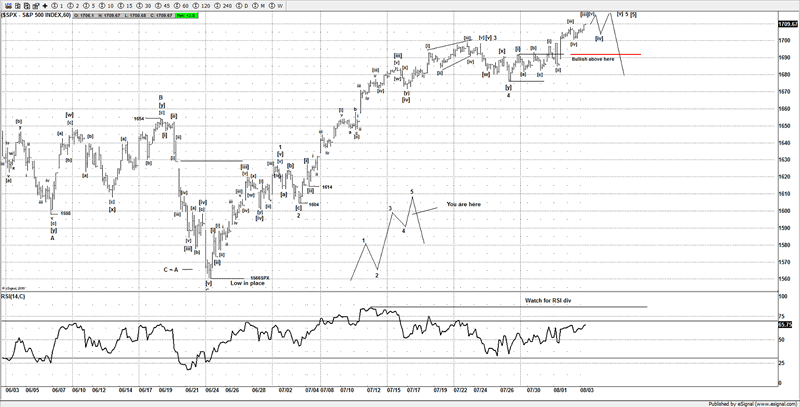
From the June 24th lows, we have been tracking a 5 wave advance and the pop on Friday possibly ended that move, although if there is a bit more upside, I don't think it's much, so I think the markets are offering us a great setup for a reversal and one that I think at least takes us back to see 1500-1530SPX.
Ideally a small dip is seen on Monday then a new high, although there is a way that it could have ended wave 5 of [5], Holding above 1692SPX keeps the market looking higher and could target 1720SPX.
But it's now that I am advising members to start looking at buying puts and think about selling short this market. We have waited a while for things to come together much to the disgust of the bears we have remained long this market, waiting for those pieces of the jigsaw puzzle to come together.
When most of the crowd is all looking the same way, I find the best set ups are the ones that anticipate a reversal by going against the crowd, now is potentially one of the times.
SPX (long term)
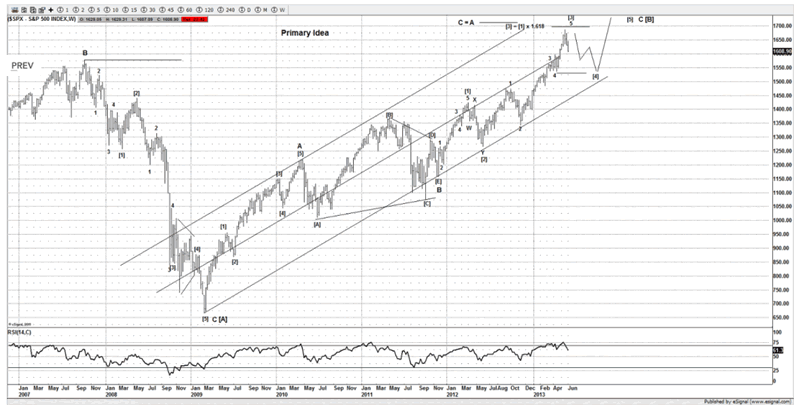
My preferred count from the March 2009 lows potentially could be close to ending now, with the RSI divergence, it's the 1st time since April 2011 we have seen such a divergence, and we all know what happened after that.
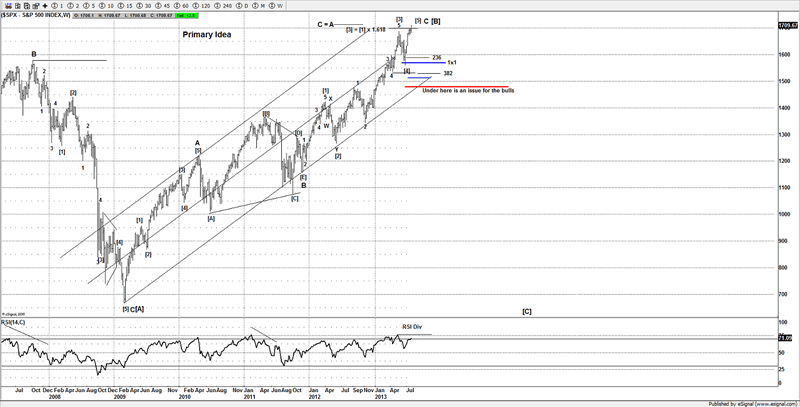
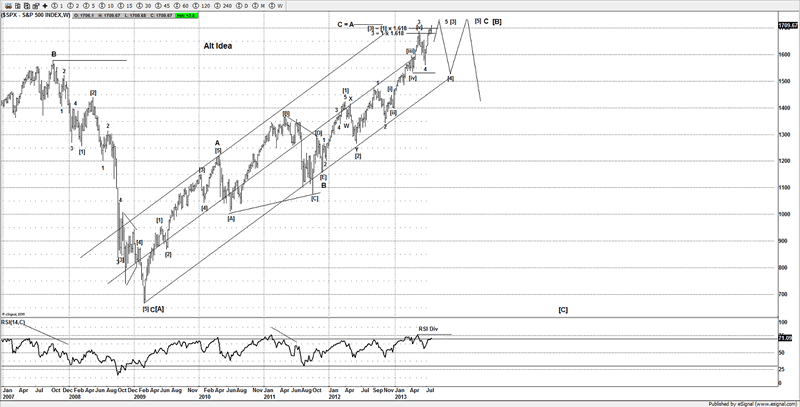
The alternative idea I am working still suggests a potential pullback towards 1500-1530SPX, so both ideas suggest caution for the bulls.
With a strong RSI divergence I suggest caution for anyone that is long this market, and suggest locking in $$$.
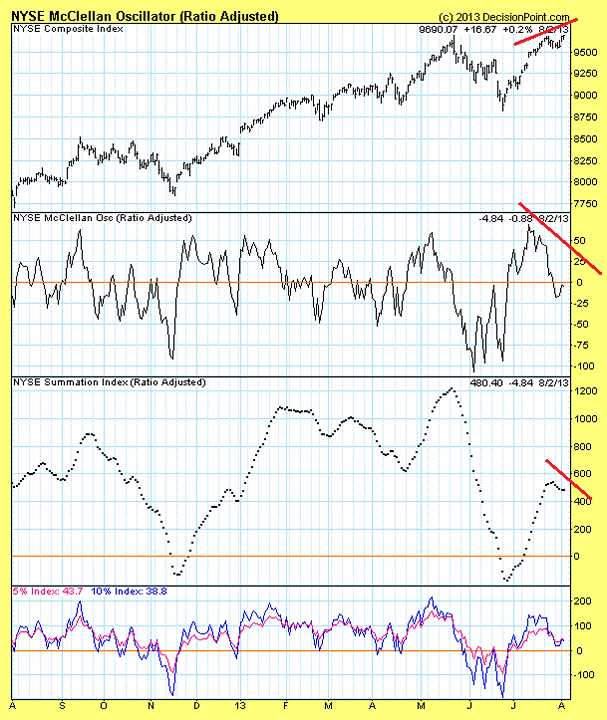
Looking at the NYSE McClellan Osc, we can clearly see that its showing a large divergence as the market has pushed higher, so a warning sign for those that are looking "under the hood".
NYSE
When looking at the NYSE, it still needs a minor new high, and a yearly new high to complete a potential long term idea.
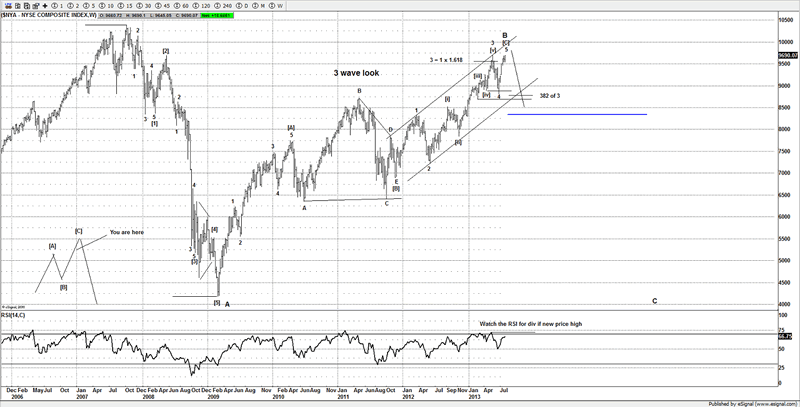
Another market that appears to be showing a RSI divergence with price.
One of the reasons I suspect that the move from March 2009 is a large B wave, is due to the look of some markets such as the NYSE and FTSE, whilst the SPX and DOW have supported a stronger move, we have yet to see new all time highs on the FTSE and NYSE, which is a major non confirmation with the SPX and DOW.
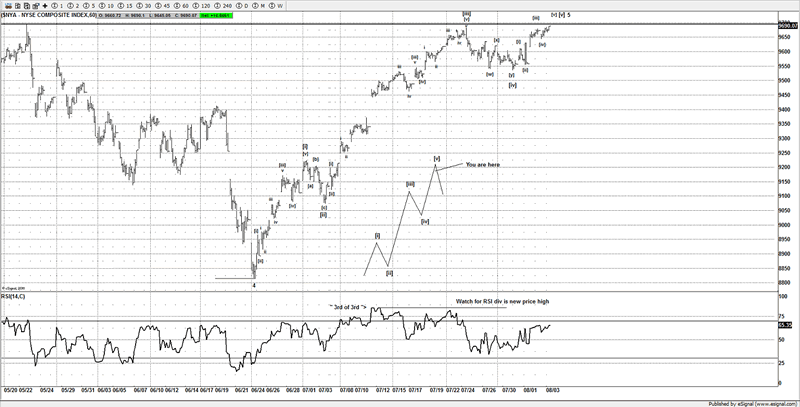
If you look carefully it's a similar appearance to the SPX and the same 5 wave look from June 24th lows, that's the more important part and structure than as traders we are interested in the most, as once we can confirm a peak in place, I am expecting a strong move lower.
Sentiment is ripe and ready for a large move lower, when I was looking for a low near 1560SPX it was rare to find anyone as bullish as we were, yet we were looking for a move back to 1700SPX.
All I was reading was the next great crash had started, now that the bears have been stopped and run over, its now that I am getting bearish and looking to sell this market, right about the time when most bears have turned bullish or have given up selling the market.
The conditions today remind me of the peak back in April 2011, back then you could not find a bear in sight, similar to today.
There are a few other clues I have found that also support that case of a large move lower, such as the patterns on the DAX, DOW and the VIX being back to historical levels.
If you are interested in being on the right side of the market, come take a free trial for a week and see what we have to offer. http://www.wavepatterntraders.com/topic/...
If you are long this market I urge you to tread carefully as if the next move happens the way I expect, then the next target is back to 1500SPX.
Until next time
Have a profitable week ahead
Click here to become a member
You can also follow us on twitter
What do we offer?
Short and long term analysis on US and European markets, various major FX pairs, commodities from Gold and silver to markets like natural gas.
Daily analysis on where I think the market is going with key support and resistance areas, we move and adjust as the market adjusts.
A chat room where members can discuss ideas with me or other members.
Members get to know who is moving the markets in the S&P pits*
*I have permission to post comments from the audio I hear from the S&P pits.
If you looking for quality analysis from someone that actually looks at multiple charts and works hard at providing members information to stay on the right side of the trends and making $$$, why not give the site a trial.
If any of the readers want to see this article in a PDF format.
Please send an e-mail to Enquires@wavepatterntraders.com
Please put in the header PDF, or make it known that you want to be added to the mailing list for any future articles.
Or if you have any questions about becoming a member, please use the email address above.
If you like what you see, or want to see more of my work, then please sign up for the 4 week trial.
This article is just a small portion of the markets I follow.
I cover many markets, from FX to US equities, right the way through to commodities.
If I have the data I am more than willing to offer requests to members.
Currently new members can sign up for a 4 week free trial to test drive the site, and see if my work can help in your trading and if it meets your requirements.
If you don't like what you see, then drop me an email within the 1st 4 weeks from when you join, and ask for a no questions refund.
You simply have nothing to lose.
By Jason Soni AKA Nouf
© 2013 Copyright Jason Soni AKA Nouf - All Rights Reserved
Disclaimer: The above is a matter of opinion provided for general information purposes only and is not intended as investment advice. Information and analysis above are derived from sources and utilising methods believed to be reliable, but we cannot accept responsibility for any losses you may incur as a result of this analysis. Individuals should consult with their personal financial advisors.
WavePatternTraders Archive |
© 2005-2022 http://www.MarketOracle.co.uk - The Market Oracle is a FREE Daily Financial Markets Analysis & Forecasting online publication.