


Stock Market Downtrend Continues
Stock-Markets / Stock Markets 2013 Aug 24, 2013 - 07:38 PM GMTBy: Tony_Caldaro

 The market opened the week flat, made a new downtrend low Monday, retested that low Tuesday, then made a lower low after the FOMC minutes on Wednesday. After that the market rallied for the rest of the week. For the week the SPX/DOW were mixed, the NDX/NAZ were +1.55%, and the DJ World index lost 0.3%. It is interesting that the DOW has confirmed the downtrend, while the SPX/NDX/NAZ have yet to do so. On the economic front it was another mixed week. On the uptick: existing home sales, FHFA housing prices, leading indicators and the monetary base. On the downtick: new home sales, the WLEI, and weekly jobless claims rose. Next week the first revision to Q2 GDP, plus PCE prices, Personal income/spending and Consumer sentiment. Best to your week.
LONG TERM: bull market
After 4+ years of rising equity prices, QE 1, 2, 3 and Operation Twist, some believe this bull market will go on forever. How soon we forget. Just 15 years ago many were talking about the new paradigm: the internet. The dotcom driven Nasdaq lost nearly 80% of its value after that 2000 peak. Just 6 years ago many considered the sub prime mortgage problem to be small, including the FED. The SPX/DOW lost more than 50% after that 2007 peak.
Bear markets usually begin when they are generally least expected. The buy the dip mentality continues even after a market tops. Most thinking it is only a correction. As the uptrends make lower highs and the downtrends lower lows investor sentiment eventually reaches a point of recognition. Then the bear market accelerates to the downside. We are not there yet. But this is something to keep in mind in the months ahead.
The March 2009 bull market continues to unfold as expected. This is a five Primary wave bull market, and Cycle wave [1] of Super cycle 3. Primary waves I and II completed in 2011, and Primary wave III has been underway since then. Primary I divided into five Major waves, with a subdividing Major wave 1. Primary III has also been dividing into five Major waves, but both Major waves 1 and 3 have subdivided into five Intermediate wave/trends. Major waves 1 and 2 of Primary III completed by mid-2012. Major wave 3 has been underway since then.
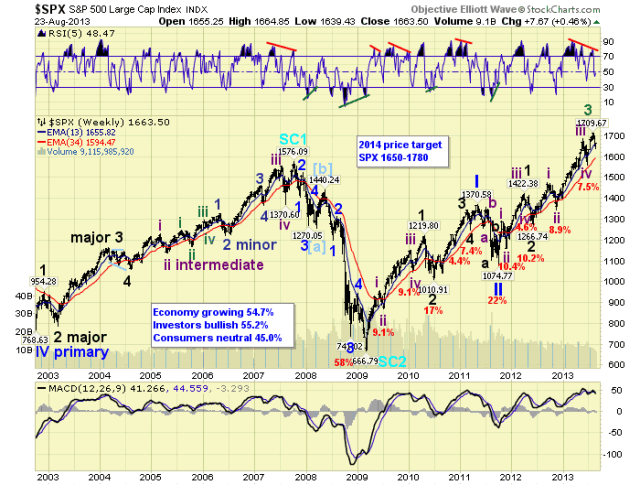
Intermediate waves i and ii of Major 3 completed by late-2012, Intermediate waves iii and iv completed by mid-2013, and Intermediate wave v just completed in August. With Major wave 3 completed a Major wave 4 correction is underway. When this correction concludes we will still have, at least, two more uptrends before the bull market ends: Major wave 5 and Primary wave V. We still expect the bull market to end in late-winter to early-spring in 2014.
MEDIUM TERM: DOW down trending, awaiting confirmation in the SPX
After the Intermediate wave iv correction low in June at SPX 1560, we expected an Int. wave v uptrend into July/August reaching at least the OEW 1699 pivot range. This uptrend was to unfold in five Minor waves, and it did: SPX 1627-SPX 1605-SPX 1699-SPX 1676- SPX 1710. At the early-August high we identified an ending diagonal triangle Minor 5th wave in the DOW. A terminating pattern. Then the market went into correction mode.
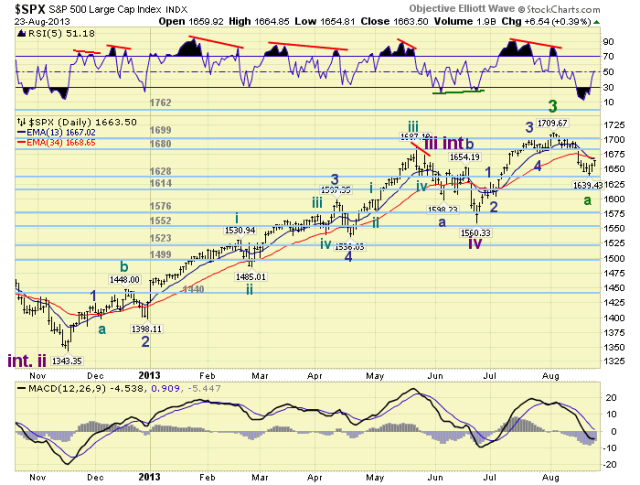
Since the June-August uptrend was Int. wave v of Major wave 3. Major wave 3 completed at that high and a down trending Major wave 4 wave was underway. We expect Major 4 to correct about 10%, create a three Intermediate wave abc pattern, with the three Int. waves reaching approximately: 1630-1670-1540. Thus far the market has declined from SPX 1710 to 1639, and recently started to rally. This decline is most likely Int. wave A, and the rally Int. wave B. When this counter rally concludes a sharp Int. wave C decline should follow. After this correction concludes the market should rally to new highs in five Int. waves to complete Major wave 5 and Primary wave III. Medium term support is at the 1628 and 1614 pivots, with resistance at the 1680 and 1699 pivots.
SHORT TERM
From the Major wave 3 SPX 1710 high we have counted, thus far, three Minor waves down: A 1685-B 1700/1697-C 1639. This abc pattern completes a zigzag formation and likely concludes Int. wave A of the correction. On Wednesday and Thursday/Friday the SPX staged its two best rallies since the correction began: 18 points and 23 points. This suggests Int. wave B is underway. But we would like to see the SPX clear 1671 to help confirm. Our one concern is the DOW. Its best rally, during the entire decline, was 160 points. But that was well over a week ago. It has not participated much in the recent SPX/NDX/NAZ rally. Should it roll over again, before rallying strongly, it could drag the SPX down with it extending Int. wave A. The DOW is certainly worth keeping an eye on in the week ahead.
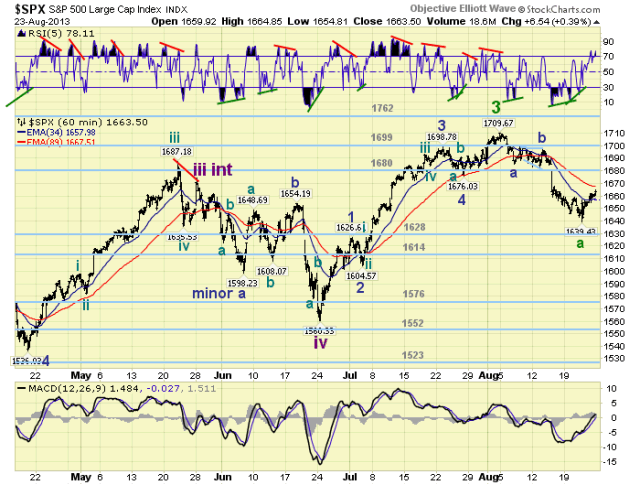
Should this rally be indeed Int. wave B, we would expect it to continue higher into the OEW 1680 pivot range (1673-1687). After that it should top with an extreme overbought condition, or display a negative divergence, then Int. wave C should start to unfold. Short term support is at SPX 1648-1649 and SPX 1636-1640, with resistance at SPX 1658-1667 and the 1680 pivot. Short term momentum is displaying a very slight negative divergence at Friday’s close. The short term OEW charts turned positive, with the reversal level SPX 1662. Best to your trading next week.
FOREIGN MARKETS
The Asian markets were mostly lower on the week for a net loss of 2.5%. India, Indonesia, Japan and Singapore are all in confirmed downtrends.
The European markets were mostly lower as well for a net loss of 1.0%.
The Commodity equity group was mixed for a net gain of 0.2%.
The DJ World index is still uptrending but lost 0.3% on the week. Currently 25% of the world’s stock indices are in confirmed downtrends.
COMMODITIES
Bonds continue to downtrend losing 0.6% on the week.
Crude remains in a weakening uptrend losing 1.0% on the week.
Gold continues its bear market rally uptrend gaining 1.5% on the week.
The USD continues to downtrend, but may be bottoming, gaining 0.1% on the week.
NEXT WEEK
Monday: Durable goods orders at 8:30. Tuesday: Case-Shiller and Consumer confidence. Wednesday: Pending home sales. Thursday: Q2 GDP (est. +2.1%), and weekly Jobless claims. Friday: Personal income/spending, PCE prices, Chicago PMI and Consumer sentiment. Still nothing on the FED’s calendar. Best to your weekend and week!
CHARTS: http://stockcharts.com/public/1269446/tenpp
http://caldaroew.spaces.live.com
After about 40 years of investing in the markets one learns that the markets are constantly changing, not only in price, but in what drives the markets. In the 1960s, the Nifty Fifty were the leaders of the stock market. In the 1970s, stock selection using Technical Analysis was important, as the market stayed with a trading range for the entire decade. In the 1980s, the market finally broke out of it doldrums, as the DOW broke through 1100 in 1982, and launched the greatest bull market on record.
Sharing is an important aspect of a life. Over 100 people have joined our group, from all walks of life, covering twenty three countries across the globe. It's been the most fun I have ever had in the market. Sharing uncommon knowledge, with investors. In hope of aiding them in finding their financial independence.
Copyright © 2013 Tony Caldaro - All Rights Reserved Disclaimer: The above is a matter of opinion provided for general information purposes only and is not intended as investment advice. Information and analysis above are derived from sources and utilising methods believed to be reliable, but we cannot accept responsibility for any losses you may incur as a result of this analysis. Individuals should consult with their personal financial advisors.
Tony Caldaro Archive |
© 2005-2022 http://www.MarketOracle.co.uk - The Market Oracle is a FREE Daily Financial Markets Analysis & Forecasting online publication.